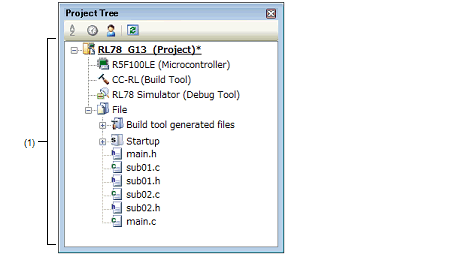
This panel is used to display the project components (microcontroller, build tool, debug tool, etc.) in a tree structure.
On this panel, you can select or change the debug tool to use.
The following items are explained here.
Project components are displayed in tree view with the following given node.
|
The debug tool (IECUBE, E2, E2 Lite, E1(Serial), E20(Serial), EZ Emulator, COM Port or Simulator) currently being used in the project is displayed. |
Select the debug tool node to configure with the Property panel. If the Property panel is not being opened, double-click the node to open the corresponding Property panel.
|
The following cascade menus are displayed to select the debug tool to use. |
||
|
Uses E20 with serial communication method as the debug tool. |
||
|
Displays the selected category node's property in the Property panel. |
||