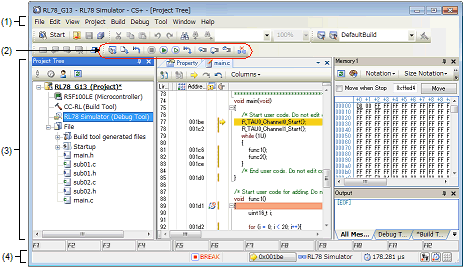
This window is automatically opened when CS+ is started up.
In this window, you can control the program execution and open panels for the debugging process.
This section describes the following.
In Windows 8.1, select [CS+ for CC (RL78,RX,RH850)] on the start screen. |
Menu items related to the debugging are as follows:
The items that can be selected in each menu can be customized using the User Setting dialog box. |
The [View] menu provides the following items and functions (default).
|
The following cascade menus are displayed to open the Watch panel. These items are disabled when disconnected from the debug tool. |
||
|
Opens the Local Variables panel. |
||
|
Opens the Call Stack panel. |
||
|
The following cascade menus are displayed to open the Memory panel. These items are disabled when disconnected from the debug tool. |
||
|
Opens the SFR panel. This item is disabled when disconnected from the debug tool. |
||
|
Opens the CPU Register panel. This item is disabled when disconnected from the debug tool. |
||
|
Opens the Trace panelNote. This item is disabled when disconnected from the debug tool. |
||
|
The following cascade menus are displayed to open the Disassemble panel. These items are disabled when disconnected from the debug tool. |
||
|
Opens the Events panel. This item is disabled when disconnected from the debug tool. |
||
|
Opens the Virtual Board panel [Simulator]. This item is disabled when disconnected from the debug tool. This item is also disabled even if a device for which the debug tool for the active project does not support peripheral function simulations is currently connected to the debug tool. |
||
|
Displays the current PC position in the Editor panel. This item is disabled when disconnected from the debug tool. |
||
|
Goes back to the position before jumping (see "2.7.2.4 Move to the symbol defined location") to the defined location. This item is disabled when disconnected from the debug tool. |
||
|
Forwards to the position before operating [Back to Last Cursor Position]. |
||
|
Jumps to the corresponding line/column in the corresponding file if the information of a file name/line number/column number exists in the line at the caret position on the Editor panel/Output panel (see "CS+ Editor"). |
||
[E1][E20][EZ Emulator][COM Port] |
The [Debug] menu provides the following items and functions (default).
|
Downloads the specified file(s) into the debug tool currently selected in the active project. If CS+ is disconnected from the debug tool at this time, it is automatically connected to the debug tool before a download is executed. This item is disabled during program execution/build (not including rapid build) execution. |
||
|
Builds a project and executes a download to the debug tool currently selected in the active project after the build is complete. If CS+ is disconnected from the debug tool at this time, it is automatically connected to the debug tool before a download is executed. This item is disabled during program execution/build (not including rapid build) execution. |
||
|
Rebuilds a project and executes a download to the debug tool currently selected in the active project after the rebuild is complete. If CS+ is disconnected from the debug tool at this time, it is automatically connected to the debug tool before a download is executed. This item is disabled during program execution/build (not including rapid build) execution. |
||
|
Connects to the debug tool currently selected in the active project. This item is disabled while connected to the debug tool, during build (not including rapid build) execution or if the version of compiler being used is not supported by CS+. |
||
|
Connects to the debug tool currently selected in the active project via the hot plug-in function, in order to debug the target system currently running (see "2.5.3 Connect to the debug tool using hot plug-in [E1][E20]"). |
||
|
Opens the Data Save dialog box to save the memory contents. This item is disabled during program execution/build (not including rapid build) execution or when disconnected from the debug tool. |
||
|
Disconnects from the currently connected debug tool. This item is disabled during program execution/build (not including rapid build) execution or when disconnected from the debug tool. |
||
|
The following cascade menus are displayed to select the debug tool to use. |
||
|
Uses E20 with serial communication method as the debug tool. |
||
|
Forcibly stops the program currently being executed. This item is disabled when the program is already halted or disconnected from the debug tool. |
||
|
Executes the program from the current PC position. Execution of the program will be stopped when the condition of a set break event is met. This item is disabled during program execution/build (not including rapid build) execution or when disconnected from the debug tool. |
||
|
Executes the program from the current PC position. Execution of the program continues, ignoring set break events and action events. This item is disabled during program execution/build (not including rapid build) execution or when disconnected from the debug tool. |
||
|
Executes the program step by stepNote from the current PC position (Step in execution). However, in the case of a function call, the program is stopped at the beginning of the function having been called. This item is disabled during program execution/build (not including rapid build) execution or when disconnected from the debug tool. |
||
|
Executes the program step by stepNote from the current PC position (Step over execution). In the case of a function call by the CALL instruction, all the source lines/instructions in the function are treated as one step and executed until the position where execution returns from the function (step-by-step execution will continue until the same nest is formed as when the CALL instruction has been executed). In the case of an instruction other than CALL, operation is the same as when [Step In] is selected. This item is disabled during program execution/build (not including rapid build) execution or when disconnected from the debug tool. |
||
|
Executes the program until execution returns from the current function (or returns to the calling function)Note(Return out execution). This item is disabled during program execution/build (not including rapid build) execution or when disconnected from the debug tool. |
||
|
Resets the CPU (does not execute a program) This item is disabled during build (not including rapid build) execution or when disconnected from the debug tool. |
||
|
Resets the CPU and then executes the program from the reset address. This item is disabled during build (not including rapid build) execution or when disconnected from the debug tool. |
||
|
Rewinds the debug tool to the last state that was automatically saved. Note that the data to be rewound is limited to memory and register values that can be read or written. To use this debugging function, it has to be set so in the Option dialog box. For details on the features and usage, see “Saving and Restoring the States of Debug Tools”. |
||
|
The following menus are relevant to saving and restoring of the state of the debug tool. Note that the data to be saved is limited to memory and register values that can be read or written. For details on the features and usage, see “Saving and Restoring the States of Debug Tools”. |
||
|
Restores the state of the debug tool from the n-th data file. |
||
|
Saves the current state of the debug tool in a file as the n-th data. |
||
Step execution can be carried out either in units of source lines or in units of instructions. |
The debug toolbar includes the buttons that control the execution of programs.
The debug toolbar provides the following buttons and functions (default).
The buttons on the toolbar can be customized using the User Setting dialog box. Furthermore, a new toolbar can be created using the same dialog box. |
A Group of toolbar displayed can be selected with the context menu that is displayed by right-clicking on the toolbar. |


 button is clicked.

Step execution can be carried out either in units of source lines or in units of instructions. |
This area displays the various panels.
For details on the display content, see the sections describing the individual panels.
Statusbar displays the following items of information.
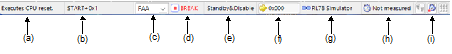
This area displays the following messages and other information.
A message reporting that the specified character string has not been found as a result of a search using the Find and Replace dialog box |
A statement of the cause of the break when a break has occurred (see "2.9 Stop Programs (Break)") |
This area displays status information on the panel currently having the focus.
Note that nothing is displayed here for a panel that has no status information.
This area is used to select a core (PE) to be debugged.
Note that nothing is displayed here when the selected microcontroller version does not support multi-core or when disconnected from the debug tool.
When the drop-down list used for switching between cores on the status bar is being displayed while the size of this window is maximized, part of the list is hidden behind the task bar and thus cannot be selected. |
This area displays the state of the program with the following icons and character strings.
Note that nothing is displayed here when the debug tool is not connected.
 RUN
RUN BREAK
BREAK STEP
STEPThis area displays the current CPU status of the debug tool. When there is the possibility that the CPU is in two or more statuses, the corresponding display contents are displayed separated by "&".
Note that nothing is displayed here when the debug tool is not connected.
This area displays the current PC position with a hexadecimal value. When this area is clicked, the caret moves to the current PC position on the Editor panel.
In addition, when the mouse pointer is placed over this area, a pop-up window appears to display the following information. Note, however, that nothing is displayed here when the debug tool is not connected.
This area displays the current state of connection with the debug tool using the following icons and character strings.

 DISCONNECTED
This area displays the result of measurement by the Run-Break Timer event (the unit of value used differs depending on the measurement amount). See "2.13.2 Measure execution time until stop of the execution".
Note that nothing is displayed here when the debug tool is not connected.
This area displays the current state of debug tool's functions using the following icons and character strings.
When a function is stopped, clicking the appropriate icon enables the state to be switched between "Use" and "Not use"Note.
Note that nothing is displayed here when the debug tool is not connected.


[IECUBE] |