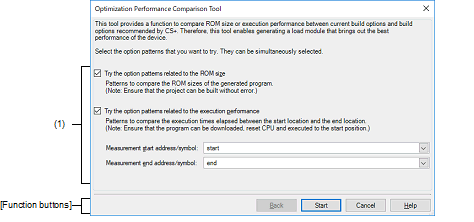
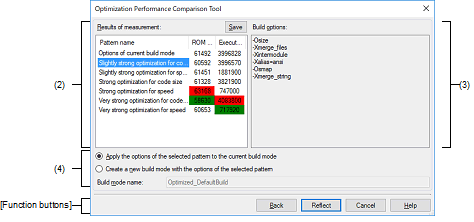
This wizard-type dialog box is used to measure and compare the ROM size or execution speed for the case in which the build options recommended by the build tool are applied.
The measurement method is specified in the first page and the result is displayed in the second page.


The following items are explained here.
From the [Build] menu, select [Open the Optimization Performance Comparison Tool for active project...]. |
Select whether to try an option pattern related to optimization of the ROM size or an option pattern related to optimization of the execution speed.
Trying both option patterns is also possible.
Along with selected patterns, the current build-mode options are tested.
When trying an option pattern related to optimization of the execution speed, specify the measurement range in [Measurement start address/symbol] and [Measurement end address/symbol].
Directly enter a hexadecimal number or address expression in each text box or select one from the input history via the drop-down list (up to 10 items).
The symbol name at the current caret position can be complemented by pressing the [Ctrl] + [Space] keys in this text box. |
If you enter a function name in each text box and one or both functions are inline-expanded due to optimization, errors may occur during measurement or measurement may not be finished. In such cases, you can avoid the errors by adding the following statement before the definition of the function or functions. |
#pragma noinline function name
The ROM size and execution speed for each option pattern are displayed.
The value with the highest performance is displayed in green while the value with the lowest performance is displayed in red.
The option pattern selected here can be reflected in the current build options.
Clicking the [Save] button opens the Save As dialog box to allow saving of the contents displayed in [Results of measurement] in a specified file.
The build options set by each option pattern are displayed.
Select which build mode to reflect the build options selected in [Results of measurement] when reflecting the build options.
If the build options are to be reflected as a new build mode, the build mode name can be specified.