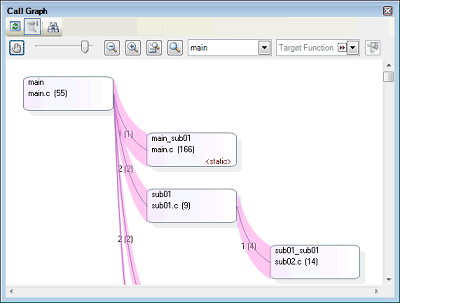
The features of the analysis tool are shown below.
The following information about functions is displayed:
Static analysis information (e.g. function name, file name, attribute, return type, reference count, etc.) and Dynamic analysis information (e.g. execution count, execution time, code coverage, etc.).

The following information about variables is displayed:
Static analysis information (e.g. variable name, file name, attribute, type, reference count, etc.) and Dynamic analysis information (e.g. read count, write count, data coverage, etc.).

A tree-structured chart (call graph) indicating calling relationships between functions in the program is displayed.

The class information [CC-RX], function information and variable information in the program are displayed in a tree structure.

The following operations can be performed on the debug tool from the various panels of the analysis tool.
Jump to the location where the specified function or variable is defined: |
Set a break event at the specified function or variable: |
Register a watch expression for the specified variable: |
You can find and display a list of locations referencing a function/variable.

A line chart indicating changes in values of variables or of data collected for Smart Analog [E1/E2/E2 Lite/E20/COM Port[RL78]] is displayed. |

