This section describes the methods to enable the debugging facilities for the generic timer IP module (GTM) from Robert Bosch GmbH, operation of each facility, and notes on usage if the selected microcontroller incorporates the GTM.
In some statements, the states of the GTM are referred to in a similar way as in the Main window as follows.
When the GTM is to be debugged, make the following settings.
[Connection with Target Board] category on the [Connect Settings] tab in the Property panel.
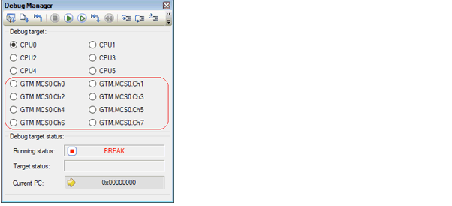
With the above settings, it is possible to select a channel of the MCS which is specified for [MCS to be debugged] in the Statusbar of the Main window or in the Debug Manager panel, as the targets for debugging.
When "MCS0" is specified for [MCS to be debugged], the channels of that MCS are displayed as the targets for debugging in the Debug Manager panel. |
When the GTM is selected as the target for debugging, each facility behaves as described below.
Synchronous execution and synchronous breaks are available for all channels of the selected MCS.
Valid events are specifiable for all channels of the MCS.
The RAM of the MCS is accessible. The displayed addresses are those in the memory space of the MCS which is selected for the [MCS to be debugged] property.
The I/O registers in the GTM are accessible.
The displayed addresses are those in the memory space of the GTM.
The CPU registers for each channel of the MCS are accessible.
The trace data of the channels of the MCS selected in the [Debug Manager] panel are displayed.
If this debugging facility is not used, the GTM is handled in the same way as other peripheral IP modules. |
The mode selected for the [Debug mode] property in the [Multi-core] category on the [Debug Tool Settings] tabbed page in the Property panel affects some aspects of the operation in the following ways. |
When a channel of the MCS is selected as the target for debugging and [Go to Here] is selected from the context menu, the CPU does not proceed with synchronous execution.
When a CPU is selected as the target for debugging and [Standby] is displayed as the state of the GTM, all channels of the MCS also proceed with synchronous execution. When all CPUs enter the break state while [Standby] is being displayed as the state of the GTM, a synchronous break is also generated for all channels of the MCS.
When a channel of the MCS is selected as the target for debugging, the CPU does not proceed with synchronous stepped execution. |
When the GTM is selected as the target for debugging and [Standby] is displayed as the state of the GTM, the following facilities are not available. |