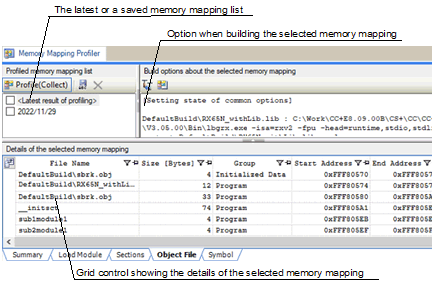
The Memory Mapping Profiler panel is used to display memory mapping information of the load module which has been collected from the build tool.
The following two methods for operating the Memory Mapping Profiler panel are available to suit the type of project.
Open a project with CS+ for CC. If there is a subproject, specify the main application project as the active project for use in displaying memory information. |
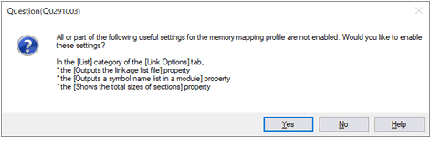
Click on the [Profile] button in the Memory Mapping Profiler panel. |

Clicking on the [Profile] button changes the button name to [Profile (Collect)].

Rebuild the project. With normal completion of rebuilding, the contents of the list file of the linker will be shown in the grid control at the bottom of the panel. The following describes each part of the panel. |
Running a rebuild is not required when [Yes] was selected in response to the message displayed in step <3> above and a rapid build has been enabled. On completion of the rapid build execution, the latest memory information is displayed in the Memory Mapping Profiler panel. |
Clicking on the [Save] button |

For details on the displayed contents and sorting or filtering in each tabbed page of the grid control, refer to the description of the Memory Mapping Profiler panel .
This method is available when a link map file (*.map) which has been generated by the build tool along with the load module file exists.
Create a new application project for CCRH, CCRL, or CCRX to display memory mapping information. Select a microcontroller which is equivalent to the target device of the load module file. |
Specify "copy<path to the link map file to be displayed>DefaultBuild\<project name>.map" for the [Commands executed after link processing] property on the [Link Options] tabbed page. |
Click on the [Profile] button in the Memory Mapping Profiler panel. |
 saves the latest result of profiling as a snapshot with a different name. When the result of profiling is updated, changes can be checked through comparison with the saved snapshot.