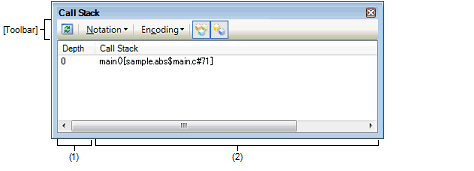
This panel is used to display the call stack information for the function call (see "2.12.1 Display call stack information").
This panel appears only when connected to the debug tool.
Nothing is displayed on this panel during execution of a program. |
When the selected microcontroller supports multi-core, this panel displays the value regarding a core (PE) by switching selection between the target cores (see "2.8 Select a Core (PE)"). |
This panel can be zoomed in and out by |

This section describes the following.
The depth of the call is displayed.
The line at the current PC position becomes 0 and incremented numbers from 1 is added to the calling function in the order.
The current source position and the call stack information pushed on the stack (position of the calling function and arguments of a each function, etc.) are displayed.
The display format in this area differs depending on the selection condition of the  /
/ button on the toolbar, or of [Show Parameter]/[Show Module File Name] from the context menu.
|
<Function>(<Argument>=<Argument ValueNote>, ...)[<Module file name>$<File name>#<Line number>] (default) |
|
|
<Function>(<Argument>=<Argument valueNote>, ...)[<File Name>#<Line number>] |
|
Array arguments are passed as pointers rather than arrays (C language specification). For this reason, if the argument is an array, it is displayed as a pointer. |
This area is provided with the following functions.
By selecting [Jump to Source] from the context menu, the Editor panel is opened with moving the caret to the source line corresponding to the calling function at the current caret position (if the Editor panel is already open, the screen will jump to the panel).
In addition, similarly by selecting [Jump to Disassemble], the Disassemble panel (Disasemmble1) is opened with moving the caret to the address corresponding to the calling function at the current caret position (if the Disassemble panel is already open, the screen will jump to the panel (Disassemble1)).
By selecting the [File] menu >> [Save Call Stack Data As...], the Save As dialog box can be opened, and all the contents of this panel can be saved in a text file (*.txt) or CSV file (*.csv).
See "2.12.1.4 Save the contents of call stack information" for details on the method for saving the contents of call stack information.
[[File] menu (Call Stack panel-dedicated items)]
The following items are exclusive for the [File] menu in the Call Stack panel (other items are common to all the panels).
Note that all these items are disabled during execution of a program.
|
Overwrites the contents of this panel to the previously saved text file (*.txt)/CSV file (*.csv) (see "(b) Saving the contents of call stack information"). Note that when the file has never been saved or the file is write disabled, the same operation is applied as the selection in [Save Call Stack Data As...]. |
|
|
Opens the Save As dialog box to newly save the contents of this panel to the specified text file (*.txt)/CSV file (*.csv) (see "(b) Saving the contents of call stack information"). |
[[Edit] menu (Call Stack panel-dedicated items)]
The following items are exclusive for [Edit] menu in the Call Stack panel (all other items are disabled).
|
Opens the Find and Replace dialog box with selecting the [Find in Files] tab. |
|
|
Opens the Find and Replace dialog box with selecting the [Replace in Files] tab. |
|
Displays the call stack information with the module file name (default). |
||
|
Displays the call stack information with the parameters (arguments) of the function call (default). |
||
|
The following cascade menus to specify the notation of values are displayed. |
||
|
Displays values on this panel in the default notation according to the type of variable (default). |
||
|
The following cascade menus to specify the encoding of character variables are displayed. |
||
|
Opens the Disassemble panel (Disassemble1) and jumps to the address corresponding to the calling function of the selected line in this panel. |
||
|
Opens the Editor panel and jumps to the source line corresponding to the calling function of the selected line in this panel. |
||
|
Opens the Local Variables panel to display the local variable corresponding to the selected line. |
||
 in the tool bar, or by moving the mouse wheel forward or backward while holding down the [Ctrl] key.
 AutoSelect
 Hexadecimal
 Decimal
 Octal
Octal Binary
 ASCII
ASCII Shift_JIS
 EUC-JP
 UTF-8
UTF-8 UTF-16
