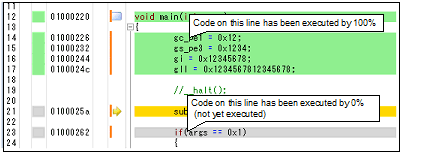
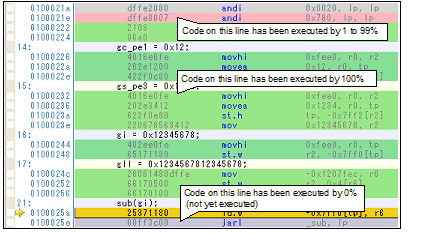
When the program starts running, a coverage measurement is automatically begun, and when the program stops running, the coverage measurement is terminated at the same time.
The code coverage rates are indicated on the Editor panel/Disassemble panel that is displaying the target program.
On each panel, the target source text lines and disassembled result lines are shown in color-coded background (see "Table 2.18") according to their code coverage rate that was calculated based on the formula described in "Table 2.17".
Note that the results are not shown when disconnected from the debug tool or during the program execution.
Selecting [Clear coverage information] from the context menu in the Editor panel/Disassemble panel will reset all the coverage information acquired, including the color-coded display on each panel.
When the selected microcontroller supports multi-core, in the Local RAM self area, note that the measurement results will be displayed only for the access in the currently selected PE (see "2.8 Select a Core (PE)"). |
The code coverage measurement result displayed on each panel is automatically updated at every program break. |
The above background colors depend on the configuration in the [General - Font and Color] category of the Option dialog box. |
The above background colors do not apply to the lines that are outside of the subject area. |
If the downloaded lode module file is older than the source file currently being open, the displaying of the code coverage measurement result is not performed in the Editor panel. |


Code coverage rates of each function can be checked via the [Code Coverage[%]] item in the Function List panel of the analyze tool. For details on "the code coverage rates of the function", see "CS+ Analysis".
Data coverage rates of each variable can be checked via the [Data Coverage[%]] item in the Variable List panel of the analyze tool. For details on "the data coverage rates of the variable", see "CS+ Analysis".


