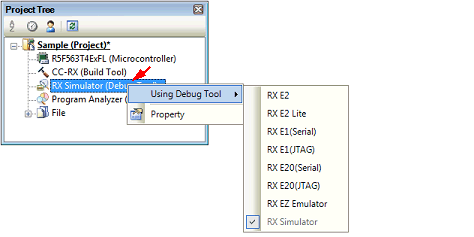
You can configure the operating environment in the Property panel corresponding to the debug tool to use.
Therefore, first, select the debug tool to be used in a project (the debug tool to be used can be specified in the individual projects).
To select or switch the debug tool, use the context menu shown by right clicking on the [Microcontroller type Debug tool name (Debug Tool)] node on the Project Tree panel.

The context menu items displayed differ depending on the microcontroller selected in the project (see "Table 2.1 Relationship between Types of Microcontroller and Connectable Debug Tools"). |
[E1] [E20] |
[EZ Emulator] |
If the Property panel is already open, click the [Microcontroller type Debug tool name (Debug Tool)] node again. The view switches to the Property panel of the selected debug tool.
If the Property panel is not open, double-click the above mentioned node to open the corresponding Property panel.