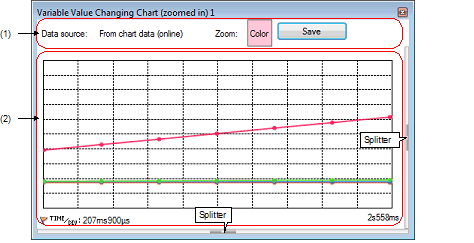
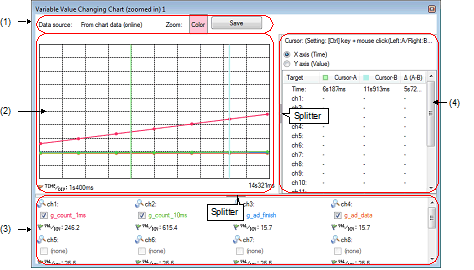
This panel is used to zoom in on the specified range on the chart displayed in the [Variable Value Changing Chart] tab of the Analysis Chart panel.
Up to a maximum of four of these panels can be opened. Each panel is identified by the names "Variable Value Changing Chart (zoomed in)1 - 4" on the title bar. From these panels, you can zoom in on the specified range individually.
See "(c) Zoom" for details on how to display the chart on this panel.
Each time the graph displayed in the [Variable Value Changing Chart] tab of the Analysis Chart panel is updated (except for the real-time display update) |
You can restore graphs currently being displayed on this panel by loading the analysis chart data file (*.mtac) which saves the data of the graphs (see “(6) Save the graph data to restore the graph“). |

You can display/hide the Channel information area and the Cursor information area by clicking the mark on the center of the splitter on this panel.

The following items are explained here.
On the [Variable Value Changing Chart] tab of the Analysis Chart panel, select the zoom 1 - 4 check box. |

Displays the data source of the graph currently being displayed.
|
Indicates that the data source is the graph currently being displayed in the [Variable Value Changing Chart] tab. |
|
|
Indicates that the data source is the information form the loaded analysis chart data file (*.mtac). |
Indicates the color of the zoom frame currently being specified with the [Zoom-1 - 4 color] property in the [General] category on the [Variable Value Changing] tab of the Property panel.
Opens the Save As dialog box to save the contents currently being displayed on this panel to the specified file (see "2.14 Save Analysis Information").

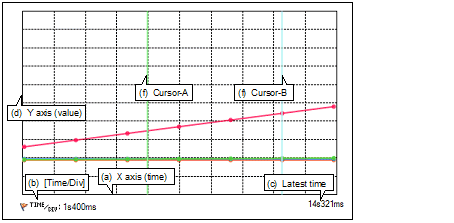
This area displays a zoomed view of the range selected on the graph in the [Variable Value Changing Chart] tab of the Analysis Chart panel.
The function of each item displayed in this area is as follows:
Displays the time per grid unit (10% of the total time for the zoom range set in the [Variable Value Changing Chart] tab of the Analysis Chart panel). This value cannot be changed.
Displays the latest time corresponding to the zoom range set in the [Variable Value Changing Chart] tab of the Analysis Chart panel.
Displays the values of the registered graphing target.
The value per grid unit (Val/Div) is 10% of the value (difference between maximum and minimum) for the zoom range set in the [Variable Value Changing Chart] tab of the Analysis Chart panel for each channel (cannot be changed).
If the origin (value = 0) exists in the zoom range, the axis line represented it will be displayed as a dotted line in the rendering color of each channel.
If the graph data obtained from the data source exceeds the minimum/maximum of the display range above, then nothing will be displayed on the graph for that segment. |
When the mouse cursor is hovered over a transition location on the graph, the information about that location appears in a pop-up.
See "(i) Pop-up display" for details on its display format.
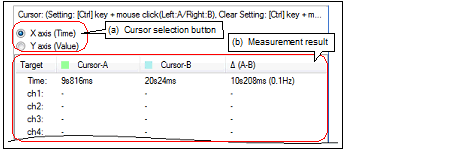
These two cursors (Cursor-A and Cursor-B) are used to check the time and value on the X axis (time) or Y axis (value).
Under Cursor selection button, select the [X axis (Time)] button to perform a cursor measurement for the X axis (time), and the [Y axis (Value)] button to perform it for the Y axis (value).
The measurement results are listed in the Cursor information area.
Use the following operations to show or hide the cursors (the cursors are hidden by default).
The display range of this area can be changed by moving the splitter with the mouse.
In addition, this area can be shown/hidden by clicking the mark on the center of the splitter (by default, this area is hidden).

Displays the name of a variable (including register name/address expression) currently being registered in a channel as a graphing target, in a check box format ("none" will be displayed if no graphing target is registered).
The character color of the variable name is the same as the rendering color of the graph.
Select the check box to display the graph corresponding to the variable (multiple selections possible).
In the default condition, the settings of the data source are reflected to these check boxes.
Note, however, that this operation is disabled during execution of a program.
Displays “the value per unit grid“ currently being specified with the [Value per grid[Val/Div] 1 - 16] property in the [Channel 1-16] category on the [Variable Value Changing] tab of the Property panel.
The display range of this area can be changed by moving the splitter with the mouse.
In addition, this area can be shown/hidden by clicking the mark on the center of the splitter (by default, this area is hidden).

Select the target axis to perform a Cursor measurement.
Note, however, that this button is disabled during execution of a program.
This area displays the following measurement result from the cursor-A and cursor-B positions.
Note, however, that the information below disappears during execution of a program.