2.4.1
Connect the debug tool to CS+
Select the [Debug] menu >> [Connect to Debug Tool] to connect to the debug tool selected in the currently active project.
After succeeding in the connection to the debug tool, the Status bar of the Main window changes as follows:
For details on each item displayed on the Status bar, see the section of the "Main window".
Figure 2.70 | Status Bar Indicating the Successful Connection to the Debug Tool |
Remark | When the  button on the Debug toolbar is clicked, it will download the specified file after connecting to the debug tool (see "2.5.1 Execute downloading").
When the  button on this toolbar is clicked, it will build the project, connect to the debug tool and then download the specified file.
 |
(1) | Display the Version Information [E1] [E20] [EZ Emulator] |
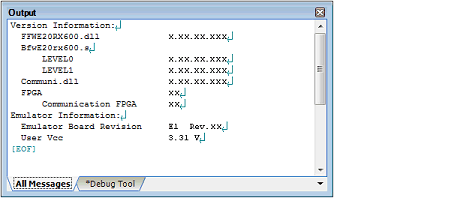
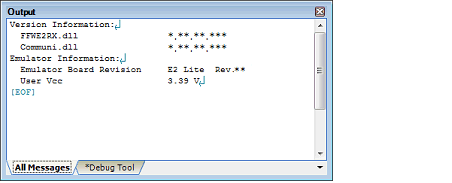
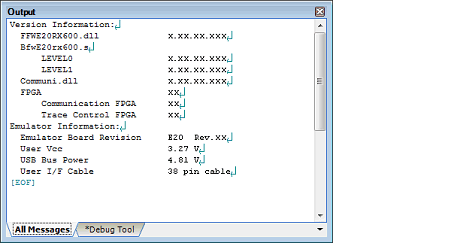
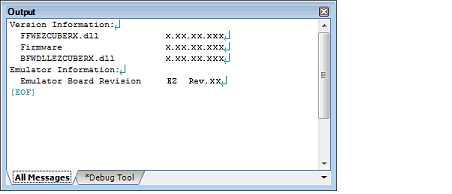
After successful connection to the debug tool, the version information such as the emulator firmware version and the emulator information such as supplied voltage are displayed on the Output panel.
Figure 2.71 | Output Panel after Connection [E1] |
Figure 2.72 | Output Panel after Connection [E2 Lite] |
Figure 2.73 | Output Panel after Connection [E2] |
Figure 2.74 | Output Panel after Connection [E20] |
Figure 2.75 | Output Panel after Connection [EZ Emulator] |
Caution | [E1] [E20]
When the emulator firmware should be updated, it is automatically updated. To ensure this update, do not disconnect the USB or power supply until connection is established. |


 button on the
  button on this toolbar is clicked, it will build the project, connect to the debug tool and then download the specified file.