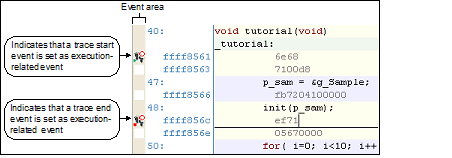
On the Editor panel or Disassemble panel, set the events at which you want the collection of trace data to start and finish.
By setting execution-related events for the trace start and trace end events, it is possible to start and finish the collection of trace data at any place.
To set an execution-related event as the trace start event, move the caret to the line or addressNote at which you want the collection of trace data to start and then choose [Start Tracing] from [Trace Settings] on the context menu.
A trace start event is set for the instruction at the beginning address corresponding to the line or address at the caret position.
Also, when you set an execution-related event as the trace end event, move the caret to the line or addressNote at which you want the collection of trace data to finish and then choose [Stop Tracing] from [Trace Settings] on the context menu.
A trace end event is set for the instruction at the beginning address corresponding to the line or address at the caret position.
When trace start and trace end events are set, the following event marks are displayed in the event area of the relevant line or address.
Figure 2.144 Example of Trace Start and Trace End Events Set by Using Execution-related Events |

By setting access-related events for the trace start and trace end events, it is possible to start and finish the collection of trace data when a specified access is made to any variable or I/O register.
At this time, it is also possible to limit the values accessed.
The types of access specifiable in access-related events are as follows:
Accesses by DMAC (Direct Memory Access Controller) and DTC (Data Transfer Controller) are not supported. |
To set events for variables or I/O registers in source text or disassembled text |
No trace event can be set for a variable or I/O register on a line whose background color in the event area is grayed (indicating that the line cannot be converted into a corresponding address). To set this trace event, select a variable or I/O register on a line whose background color in the event area is white. |
The types of access that can be set from the source text or disassembled text are only a read/write. To change the access type to a read or write, after setting trace start and end events, edit them in a dialog box that opens from the Events panel (see “2.13.3.4 Editing trace start and trace end events"). |
To set events for registered watch-expressions |
Only the watch-expressions in current scope are selectable. |
The access types that can be set from watch-expressions are only a read/write. To change the access type to a read or write, after setting trace start and end events, edit them in a dialog box that opens from the Events panel (see “2.13.3.4 Editing trace start and trace end events"). |
When a trace start event and trace end event are set, they are managed collectively on the Events panel as one instance of a trace event. (When you click the "+" mark at a trace event item, detailed information on the trace start and trace end events you've set is displayed.)
When both the trace start and trace end events have been set, trace data is collected every time the start condition and end condition are met. In such cases, the disassembled code displayed in the [Trace] panel will not be correct. |
[E20(JTAG) [RX600, RX700 Series]] |
If either one of the trace start and trace end events set is Enabled, the unconditional trace event check box on the Events panel is automatically deselected, so that the trace data from the trace start event to the trace end event is collected. |
The trace start event may be left unset if it is unnecessary. If the trace start event is not set, trace data collection starts when program execution starts. Likewise, if the trace end event is not set, trace data collection ends when program execution stops. |
The event mark varies with the set states of events (see “2.17.1 Changing states of setting (Enabled/Disabled)"). |
[Simulator] |


 is displayed, indicating that multiple events have been set.