Overview of Coverage Analysis

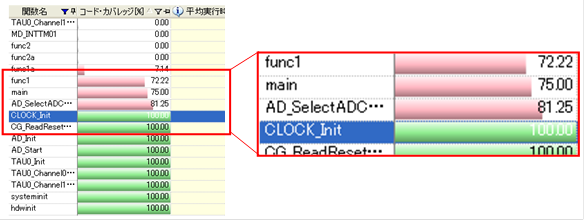
Coverage analysis makes it possible to ascertain how much of the program is executed, and efficiently look for wasted processing. Below is shown the Code Coverage column of the Function List panel, which shows the program's execution ratio. This lets you tell at a glance how much of the program was executed, at the function level. For example, the figure shows that the coverage of main and func1 is not 100%, which tells us that part of the program was not executed.

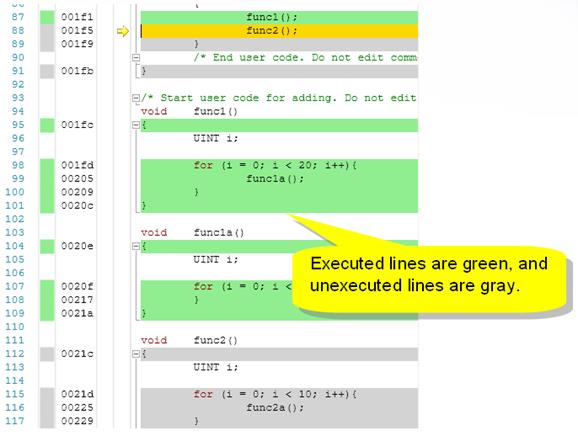
After ascertaining which parts of the program were not executed at the function level, you can display the functions in the editor as shown below, in order to ascertain which lines were not executed.

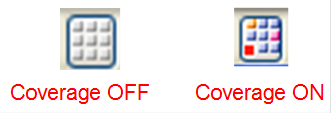
In this tutorial, we omit the instructions for coverage analysis. You can click the icon in the lower right of the main window as shown below in order to enable or disable code coverage, so please try it yourself.
