Basic Method for Analyzing Execution Performance

To get started, let us try using the Execution Time Ratio analysis graph in order to familiarize ourselves with actual analysis of execution performance.
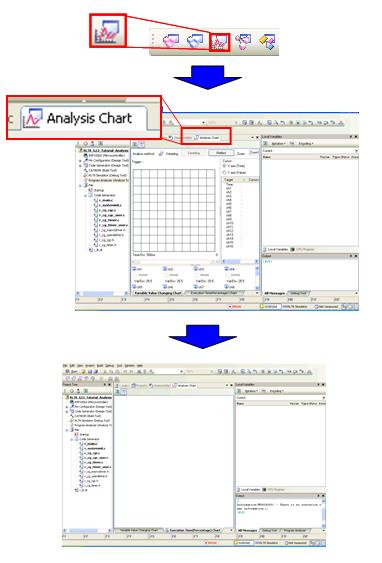
Follow the steps below to open the Analysis Graph panel.
|
Click the [Analysis Graph Panel] button, and open Analysis Chart . Next, click the [Execution Time Ratio] tab. |

|
Analysis Chart appears. At this stage, no trace data has been acquired, so the message "No execution time information" appears. |
The analysis graph shows the proportions of execution time. It is drawn based on trace data (the CPU's execution history). Configure it to use the trace function by following the steps below.
*There is also a configured project.
|
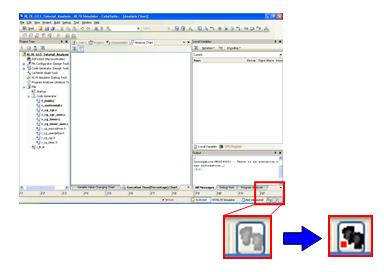
In the main window, click the [Trace] icon. |

|
The [Trace] icon changes, and the simulator is configured to use the trace function. |
Now, let us set a breakpoint and run the program using the following steps.
|
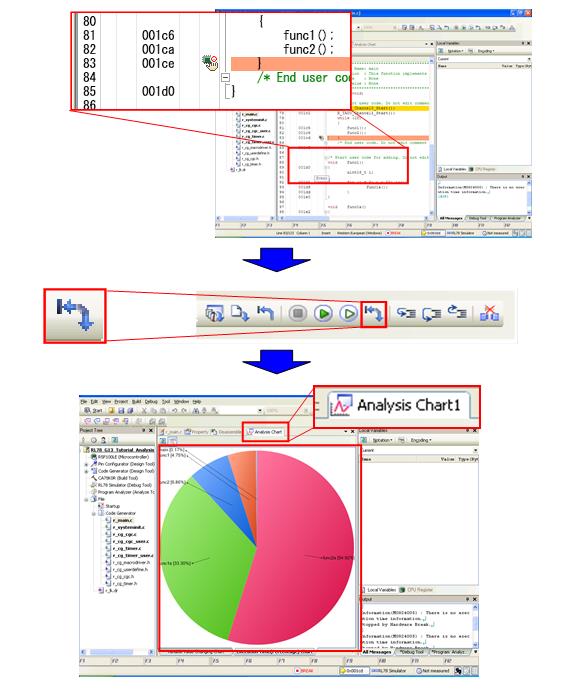
Set a breakpoint as shown in the figure below, and from the menu, press the [Reset & Run] button. |

|
A graph of the share of execution appears in Analysis Chart . |
Have a look at the proportions of execution time. func2a takes about twice as much time as func1a. Actually, we cannot obtain the results we are after from this graph. func1a and func2a perform nearly the same processing, but func1a is called 20 times, while func2a is only called 10 times. Therefore, func1a must be taking a larger proportion of the execution time than func2a.
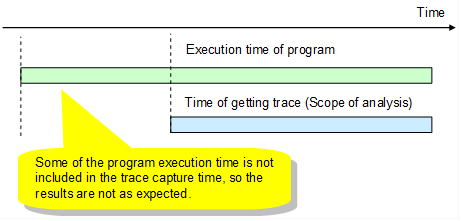
As shown in the figure below, this is caused by the fact that the trace-capture period is shorter than the execution time we want to analyze. In other words, it is because we do not have enough trace data.
* RX has 64K trace frame as minimum size. Its enough trace data in this case.
The following method is useful for determining whether the time for which you are acquiring trace data is sufficient to analyze the execution time.
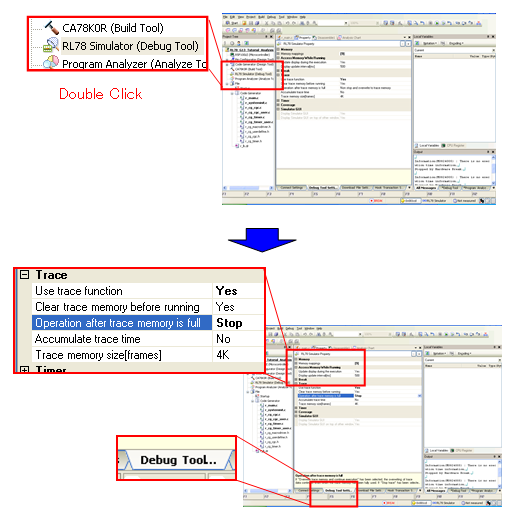
As shown below, in the debugging tool properties, set "Behavior after all trace memory is used" to [Stop].
|
As shown in the figure below, in the debugging tool properties, set "Behavior after all trace memory is used" to [Stop]. |

|
This setting stops program execution when all trace memory has been used. |
As shown below, this setting will include all program execution time in the analysis scope.

So let us reset the CPU, and run the program again.
|
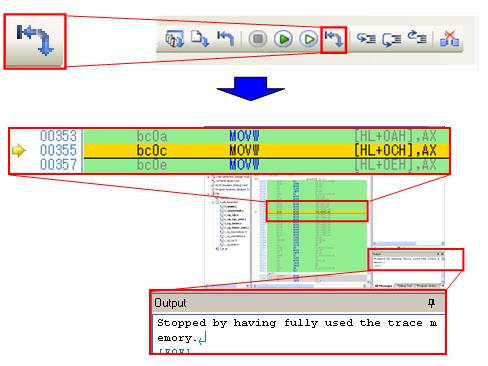
From the menu, press the [Reset & Run] button. |

|
The program execution stops when all trace memory has been used. You will note that the program execution did not reach the breakpoint that we set. |
As shown below, the trace-capture period was not long enough to cover the actual range that we want to analyze, because the breakpoint was not reached.

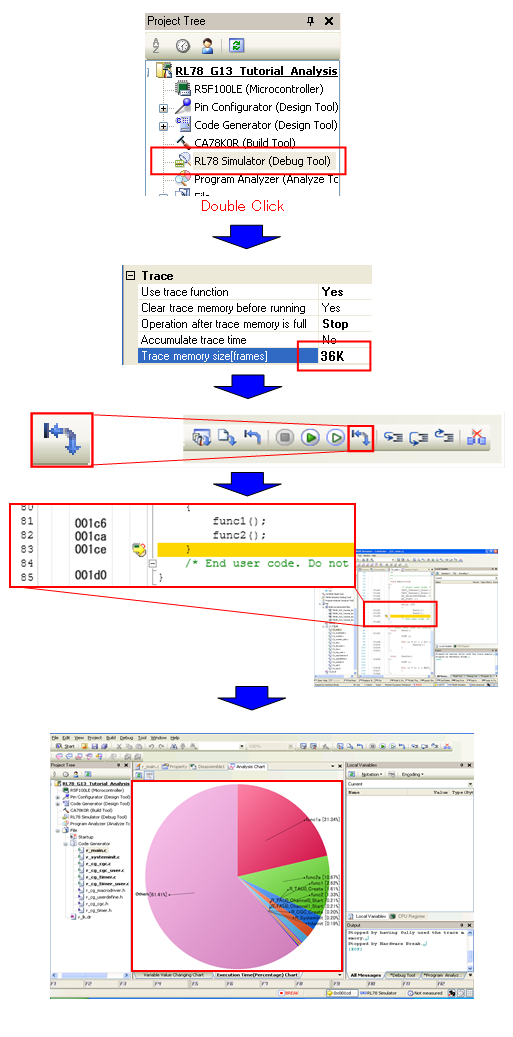
So let us increase the size of the trace memory. In the debugging tool properties, change the "Trace memory size" setting from 4K to 36K. Reset the CPU, and run the program again.
|
As shown in the figure below, in the debugging tool properties, change the "Trace memory size" setting to 36K, then from the menu, press the [Reset & Run] button. |

|
Program execution stops at the breakpoint, and the results appear in Analysis Chart . |
This time, the program stopped at the breakpoint. This means that the trace-capture period was long enough to cover the entire range of program execution time that we want to analyze.

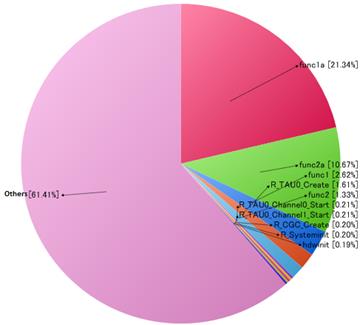
Have a look at the analysis graph. This time, the proportion of execution time taken by func1a is about double that of func2a, showing that we have obtained correct results. The reason why it is not exactly double is because interrupts, processing to leave functions, and processing to return from functions is included.
As described above, when performing analysis it is vital to make sure that the data to be used for analysis (the debugging tool's trace memory) is appropriate for the range that you wish to analyze.
Actual programs involved in system control, however, make frequent use of conditional statements. For this running the program 1 time and running it 100 times could yield completely different function execution ratios. In the following pages, we describe how to perform statistical analysis.