This panel is used to display the tree-structured chart (call graph) that indicates calling relationships between functions.
The following types of function/variable are displayed in this panel.
Note, however, that the function information and variable information in the files not to be analyzed is not displayed in this panel (see "1.1.1 What is analyzed").
See "2.4 Display Calling Relationships between Functions (Call Graph)" for details on how to display the call graph.
If the debug tool to use does not support the trace function, or if the debug tool's trace function is not enabled, then the Dynamic analysis information (e.g. the execution count/read count/write count) in the call graph cannot be displayed. |
[CC-RX] |
A function/variable whose source file does not exist in the project can be displayed in the call graph if the [Display the function/variable without definition at Call Graph panel] property in the [General] category on the [Settings] tab of the Property panel is set to [Yes]. |
This panel can be zoomed in and out (10 to 109 %) by |
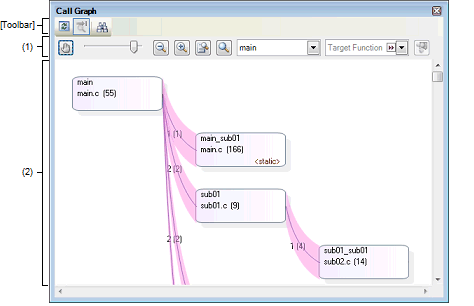
The following items are explained here.
On the toolbar in the Main window, click the |
|
Toggles whether scrolling of content is enabled by dragging the panel directly. By default, scrolling is disabled. Note that if scrolling is enabled, then the shape of the mouse cursor will change, and a function/variable will be neither highlighted (shown in selected state) nor reflected in the [Target Function Name] combo box even if clicking on a Function box/Variable box with mouse. There will also not be a Pop-up display with information about the function. |
|||||
|
Changes the call graph's zoom ratio. A number between 10 and 109 can be selected (by default, 100 is specified). You can also change the zoom by rotating the mouse wheel forward or backward while pressing the [Ctrl] key. |
|||||
|
Changes the call graph's zoom ratio. Each click of one of the buttons decrements/increments the value of the zoom slider by 1. |
|||||
|
Automatically changes the call graph's zoom ratio. The call graph is enlarged or shrunk in accordance with the size of the panel, so that the entire call graph can be displayed. |
|||||
|
Resets the zoom ratio of the call graph to the default value of 100. |
|||||
|
Selects the parent function to target for display in the call graph (it will be at the top of the call graph) from the drop-down listNote 1. By default, the first function to appear named "main"/"reset"/"start"Note 2 or containing such word is specified as the parent function (if there is no corresponding function, it will be empty). |
|||||
|
Selects the function to highlight (show in selected state) on the call graph from the following drop-down list.
When a function box is clicked in the call graph, the function is highlighted (unless scrolling via the mouse dragging is enabled by the |
|||||
|
Switches to the details view that displays the parent functions and child functions of the function currently being selected (specified with the [Target Function Name] combo box) (toggle). Note that this item is disabled during execution of a program. |
[RH850] |
This area displays a call graph indicating calling relationships between functions that have been acquired from the cross reference information.
A call graph has the following two view modes that can be toggled by clicking the  button.
By default, the first function to appear named "main"/"reset"/"start"Note 1 or containing such word is considered to be the parent function, and that function is placed on the left edge of the call graph (the corresponding parent function name will be displayed in the [Parent Function Name] combo box). If there is no corresponding function name, then the functions in the program that are not called by any other functions (reference count = 0) will be considered to be parent functions, and they will be placed on the leftmost edge (the [Parent Function Name] combo box will be empty).
Next, the child functions, grandchild functions, and so on will be placed on the call graph, from left to right (they will be arranged from top to bottom, with the functions to appear first shown topmost).
If an arbitrary parent function is specified in the [Parent Function Name] combo boxNote 2, then only the functions called by that function will appear in the call graph. If the combo box is empty, then all functions in the program will appear in the call graph.
[RH850] |
The parent functions and child functions of the function currently being specified with the [Target Function Name] combo box are displayed.
The parent functions, the target function and the child functions are placed on the call graph, from left to right (they will be arranged from top to bottom, with the functions to appear first shown topmost).
Furthermore, if global variables, static variables inside a file or static variables inside a function accessed from the target function exist, the variables also is placed immediately below the target function, as variable boxes (when the multiple variables exist, they will be arranged from top to bottom, with the variables to appear first shown topmost).
Any one of the following events will cause that the call graph is switched to whole view mode. |
The value of the [Parent Function Name] combo box has been changed (including the result of a build/rebuild in the build tool). |
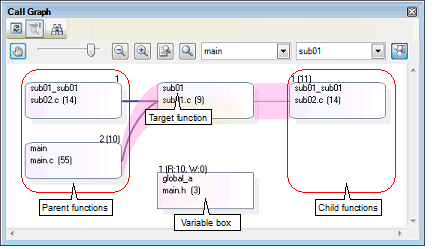
The composition of the call graph is as follows:
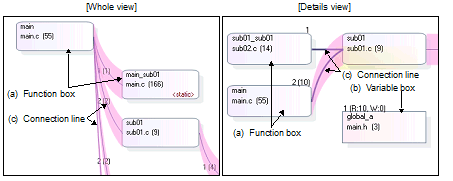
The function is displayed in a box format.
The following information is displayed in a function box.

[CC-RX] |
By double-clicking a function box, you can jump to the location of the source text where the function is defined (see "2.7 Jump to Defined Location"). |
In the details view mode, a global variable, a static variable inside a file or a static variable inside a function accessed from the target function is displayed in a box format.
The following information is displayed in a variable box.

|
Indicates the name of the target variable. If the target variable is a static variable inside a function, then this will be displayed in the format of "Variable name#Function name". |
|
|
Indicates the location at which the target variable is defined with "File name(Line number)". Note, however, that if the definition information does not exist, then this will display "(No Definition)". |
|
|
Indicates the attribute of the target variable. If the attribute other than the above, nothing is displayed in this area. |
|
|
Indicates the number of times dynamic references (R: read accesses, W: write accesses) have been made. Note that this information appears only when the trace data exist. This information is the cumulative value for each program execution when the [Accumulate result of analysis] property in the [General] category on the [Settings] tab of the Property panel is set to [Yes]. |
|
|
The current state of the target function is shown in the following background colors. |
|
|
If the selected microcontroller version supports multi-core, PE in which the target variable is assigned is shown in the following shadow colors. |
By double-clicking a variable box, you can jump to the location of the source text where the variable is defined (see "2.7 Jump to Defined Location"). |
If a given function is called statically by another function, then the function boxes of the two functions will be shown linked by a connection line. Connection lines are only displayed for static function calls. Connection lines are not displayed for dynamic function calls.
The following information is displayed by each connection line.
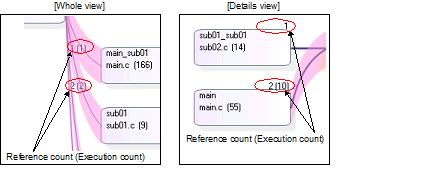
|
Indicates the number of times dynamic calls have been made, in parentheses "( )". Note that this information appears only when the trace data exist. This information is the cumulative value for each program execution when the [Accumulate result of analysis] property in the [General] category on the [Settings] tab of the Property panel is set to [Yes]. |
|
|
A connection line and reference count is displayed as follows when a function calls itself. |
|
|
As an example, say that there are functions A, B, and C. If A calls B, which calls C, which then calls A (A -> B -> C -> A), then although connection lines will be displayed for the calls of A to B and B to C, no connection line will be shown for the call of C to A. Instead, the following line segment will only be shown, to indicate a circular call. You can check information about functions in a circular call via the Pop-up display. |
If there are no static function calls but there are dynamic function calls (e.g. if function calls are only made using function pointers), then this information can be confirmed in the Pop-up display. |
When the mouse cursor is hovered over a function box/variable box, information about that function/variable appears in a pop-up.
The display format is as follows:
This function cannot be used while scrolling via the mouse dragging is being enabled by the |
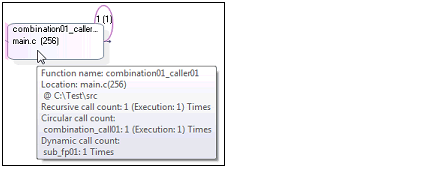
|
Location: File name(Line number) Recursive call count: Reference count(Execution: Execution count) |
When the target function is a global function or static function: |
When the target function is a member function: |
The cumulative value for each program execution is displayed as the execution count when the [Accumulate result of analysis] property in the [General] category on the [Settings] tab of the Property panel is set to [Yes]. |

When the target variable is a global variable or static variable inside a file: |
When the target variable is a class variable: |
When the target variable is a static variable inside a function: |
If the target variable is a class variable, then this will be displayed in the format of "Class name::Function name#Variable name". |
The toolbar provides the following items and functions.
|
Acquires the latest data from the debug tool, and updates the contents of this panel. Note that this item is disabled during execution of a program. |
||
|
Displays the latest information automatically by acquiring the information each time program execution stops. Note that this item is disabled if the [Refresh at program stop] property in the [General] category on the [Settings] tab of the Property panel is set to other than [Specify Individually] (this button is locked in accordance with the setting on the Property panel). |
||
|
Opens the Call Graph Search dialog box to search for a function/variable existing on this panel. |
||
[[File] menu (Call Graph panel-dedicated items)]
The [File] menu for this panel provides the following items and functions.
|
Overwrites the contents of this panel to the previously saved file (see "2.14 Save Analysis Information"). Note that when the file has never been saved or the file is write disabled, the same operation is applied as the selection in [Save Call Graph Data As...]. |
|
|
Opens the Save As dialog box to newly save the contents of this panel to the specified text file (see "2.14 Save Analysis Information"). |
[[Edit] menu (Call Graph panel-dedicated items)]
The [Edit] menu for this panel provides the following items and functions.
|
Opens the Call Graph Search dialog box to search for a function/variable currently existing on this panel. |
The context menu displayed by right-clicking on this panel provides the following items and functions.
|
Opens the Editor panel and displays the source file in which the function/variable currently being selected is defined (see "2.7 Jump to Defined Location"). |
||
|
Opens the Disassemble panel (Disassemble1) and displays the disassemble data corresponding to the start address of the function/variable currently being selected (see "2.7 Jump to Defined Location"). Note that this item is disabled while disconnecting from the debug tool. |
||
|
Opens the Memory panel (Memory1) and displays the memory list corresponding to the start address of the function/variable currently being selected (see "2.7 Jump to Defined Location"). Note that this item is disabled while disconnecting from the debug tool. |
||
|
Opens the Function List panel/Variable List panel and selects the function/variable currently being selected. |
||
|
Switches to the details view that displays the parent functions and child functions of the function currently being selected (specified with the [Target Function Name] combo box). Note that this item is disabled during execution of a program. |
||
 in the
  button.


 button), and then the function's name is also reflected in this combo box.

 button. In this case, select the target function with the
  button. In this case, disable the scroll function temporarily, then double click the target variable.

 button.

