Way to Analysis Execution Ratios Statistically

In the previous example, wet set a breakpoint, and set the scope of analysis to running the main routine one time. In this example, however, we describe how to derive the execution ratios statistically, by executing the analysis range as many times as will fit in the trace memory.
As shown below, set the analysis target to the execution ratios of func1 and func2.
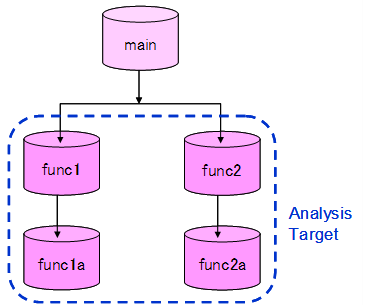
Now, remove the breakpoint from the main routine as shown below, and narrow down the target of analysis. In order to do this, set the trace-capture segment to the func1 and func2 execution segments only.
|
As shown in the figure below, in the debugging tool properties, change the "Trace memory size" setting to 12K ,and remove the breakpoint from inside the Main routine, and set the start and end points for tracing. |
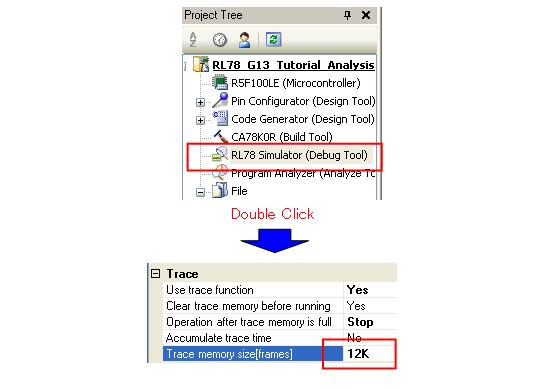


|
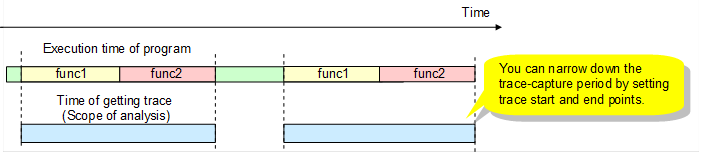
func1 and func2 become the trace-capture period. |
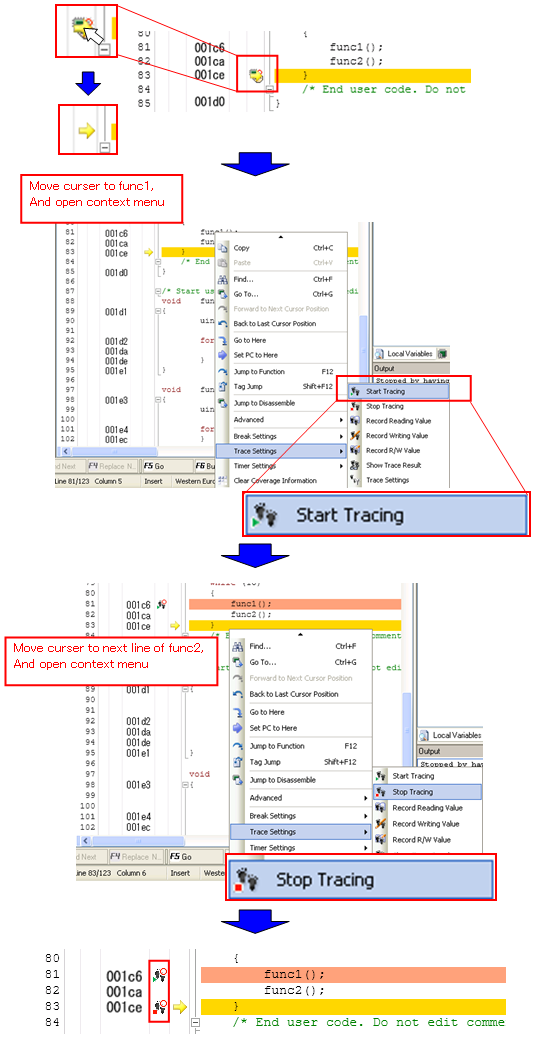
Below is an actual image of when the trace start and end points are set.
You are now finished setting the trace-capture period. Reset the CPU and run the program.
|
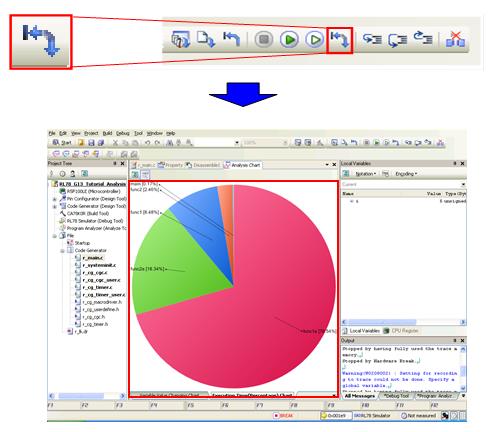
As shown in the figure below, from the menu, press the [Reset & Run] button. |

|
Program execution breaks when all the trace memory is used, and the results appear in Analysis Chart . |
Have a look at the analysis graph. The execution ratio of func1a is about 3 times that of func2a, which is different from our expected results.
The reason why func1a is taking about 3 times as much of the execution ratio as func2a is probably because, as shown below, while on the second execution func1 is executed completely, the execution of func2 stops midway, or it is not executed at all. This makes it appear that func1a is taking a larger portion of the execution time.
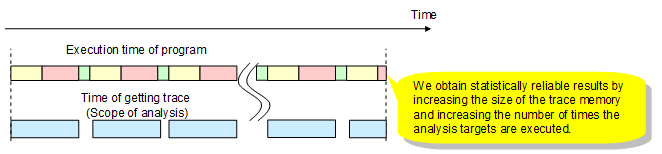
Thus, if the trace-capture period is not long enough for the analysis target, it will not be possible to judge the results of analysis correctly because the analysis target will have been executed too few times. In order to avoid this situation, CS+ makes it possible to tell how many times each function targeted for analysis has been executed, from the Function List panel. Use the following steps below to open the Function List panel.
|
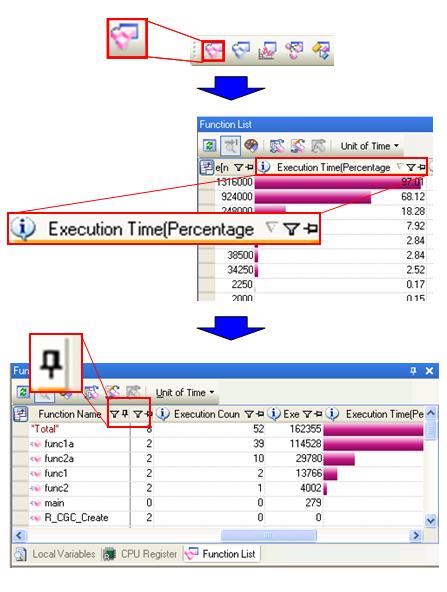
Click the [Function List Panel] button. The Function List panel opens. Sort the list by [Execution Time(Percentage)]. Also lock the display of the function-name column, so that the function names are visible. |

|
The row of function name appears statically in Function List Panel, and you can look "execution count" easily. |
As shown for the number of executions, although func1 has been executed two times, func2 has been executed only one time. You can also tell the numbers of times func1a and func2a have been executed. Be sure to ascertain the numbers of executions in the Function List panel, in order to determine whether the results you have obtained are statistically reliable.
Next, let us increase the size of the trace memory and perform the analysis again. Increase the size of the trace memory and run the program as shown below.
|
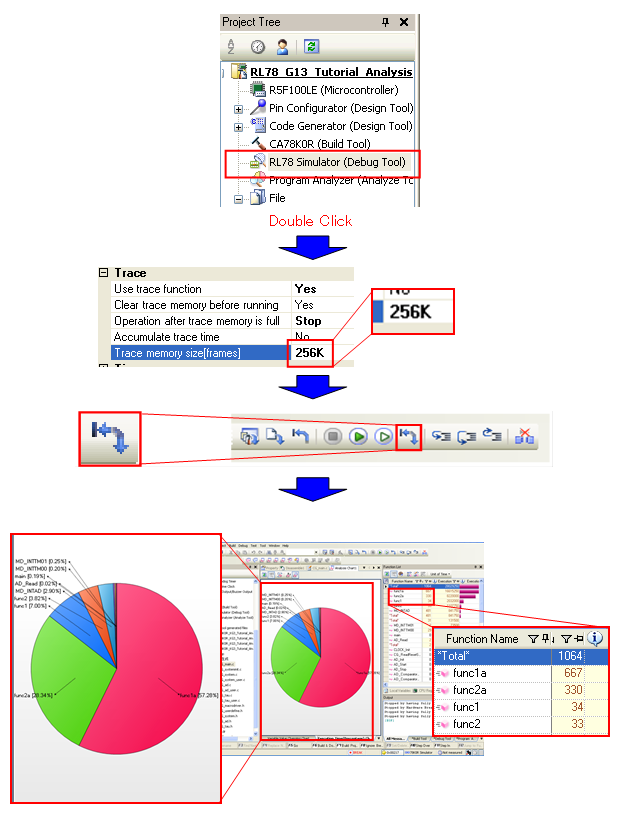
As shown in the figure below, in the debugging tool properties, change the "Trace memory size" setting to 256K, then from the menu, click the [Reset & Run] button. |

|
By increasing the trace-memory size, you increased the numbers of times func1 and func2 are executed, thereby obtaining results that are high statistically reliable. |
Have a look at the Function List panel. This time, func1 and func2 have been executed 30 times, and the execution ratios have approached our expectations for this program.
Below is a conceptual diagram of analysis when the size of the trace memory is increased.
It is thus necessary to select the appropriate method in accordance with the target of performance analysis. The analysis graph is a convenient tool, but if it is used incorrectly then it is not possible to make good judgments.
If a statistical determination is necessary, then the size of the trace memory will determine whether the results are reliable.