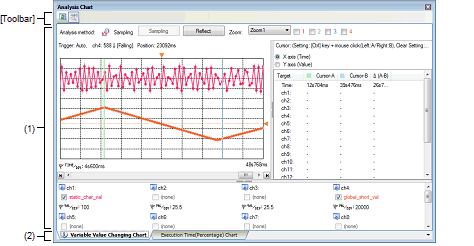
This panel is used to display charts of the acquired function information and variable information (including the data information for Smart AnalogNote).
See "2.13 Display Analysis Information in Chart" for details on how to display the chart in this panel.
[E1/E2/E2 Lite/E20[RL78]] |

The following items are explained here.
On the toolbar in the Main window, click the |
This area displays a chart relating to the acquired function information/variable information.
The type of chart is switched when a tab is selected.
In this panel, a following tab is contained (see the section explaining the tab for details on the display/setting).
A |
The toolbar provides the following items and functions.
|
Acquires the latest data from the debug tool, and updates the contents of this panel. Note that this item is disabled if no registered variables exist. |
||
|
Displays the latest information automatically by acquiring the information each time program execution stops. Note that this item is disabled if the [Refresh at program stop] property in the [General] category on the [Settings] tab of the Property panel is set to other than [Specify Individually] (this button is locked in accordance with the setting on the Property panel). |
||
[[File] menu (Analysis Chart panel-dedicated items)]
The [File] menu for this panel provides the following items and functions.
|
Overwrites the contents that are displayed on the currently selected tab to the previously saved file (see "2.14 Save Analysis Information"). Note that when the file has never been saved or the file is write disabled, the same operation is applied as the selection in [Save Analysis Chart Data As...]. |
|
|
Opens the Save As dialog box to newly save the contents that are displayed on the currently selected tab to the specified file (see "2.14 Save Analysis Information"). |
 button.
  mark is displayed on the tab if a message relating to the chart information has been output to the
