|
|
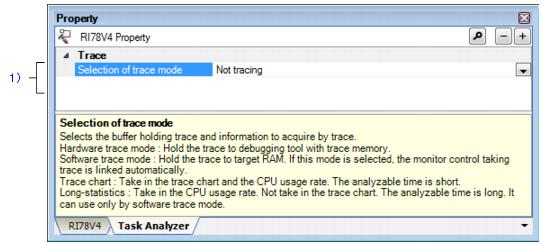
Select trace mode of Realtime OS Task Analyzer
|
|
|
|
|
|
Select from the drop-down list.
|
|
|
|
|
Can not use Realtime OS Task Analyzer.
|
Taking in trace chart by hardware trace mode
|
The trace information is collected in the trace memory which emulator or simulator has.
|
Taking in trace chart by software trace mode
|
The trace information is collected in the trace buffer secured on the user memory area.
To use this mode, implementation of user-own coding module and setup of the system configuration file are required.
|
|
|
The trace information is collected in the RI78V4's variable secured on the user memory area.
To use this mode, the trace buffer is allocated in ".kernel_data_trace_n"
|
Operation after used up the buffers
|
Select the operation after user up the trace buffer.
This item is displayed only when "Taking in trace chart by software trace mode" is selected.
|
|
|
Continue to exection while the buffers overwriting.
|
|
|
Select from the drop-down list.
|
|
|
Continue to exection while the buffers overwriting
|
It is overwritten sequentially from old information.
|
|
|
The RI78V4 stops tracing.
|
|
|
Specify the size of the trace buffer (in bytes). Please refer to "15.4 Trace Buffer Size (Taking in Trace Chart by Software Trace Mode)" for the estimate of the size of the trace buffer.
This item is displayed only when "Taking in trace chart by software trace mode" is selected.
|
|
|
|
|
|
Directly enter to the text box. Only a hexadecimal number can be entered.
|
|
|
|
|
|
This item is displayed only when "Taking in trace chart by software trace mode" is selected.
|
|
|
|
|
|
Select from the drop-down list.
|
|
|
|
The trace buffer is allocated in
".kernel_data_trace_n" section.
|
|
|
The trace buffer is allocated from
|
|
|
Specify the start address of the trace buffer.
This item is displayed only when "Another buffer" is selected.
|
|
|
|
|
|
Directly enter to the text box.
|
|
|
|
Trace the timer interrupt for Real-time OS
|
Specifies whether the timer interrupt is traced or not.
This item is displayed when "Taking in trace chart by hardware trace mode" or "Taking in trace chart by software trace mode" is selected.
|
|
|
|
|
|
Select from the drop-down list.
|
|
|
|
The timer interrupt is traced.
|
|
|
The timer interrupt is not traced.
|