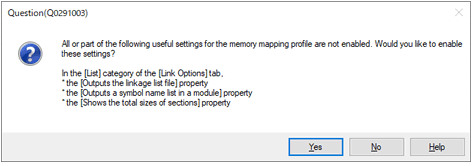
This section describes how to display the contents of linkage list files (memory map files), which are output by the linkers of the CC-RL, CC-RX, or CC-RH in the GUI.
Open a project with CS+ for CC. If there is a subproject, specify the main application project as the active project for use in displaying memory information. |
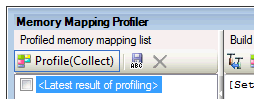
Click on the [Profile] button in the Memory Mapping Profiler panel. |
Clicking on the [Profile] button changes the button name to [Profile (Collect)].
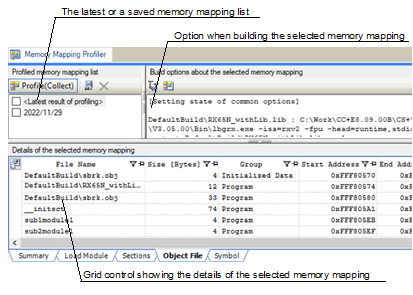
Rebuild the project. With normal completion of rebuilding, the contents of the list file of the linker will be shown in the grid control at the bottom of the panel. The following describes each part of the panel. |
If you want to check the contents shown in the grid control later, you can save them with a selected name by clicking on the [Save] button |
 .
.
For details on the displayed contents and sorting or filtering in each tabbed page of the grid control, refer to the description of the Memory Mapping Profiler panel .
Select [File] - [Save Detailed Memory Mapping Data] or [Save Detailed Memory Mapping Data As...]. |
In the Save As dialog box, select "Excel workbook" for [Save as type] and then save the file. The Excel file can freely be used for calculation. For example, assume that the Sub1.lib user library contains userlib1.c and userlib2.c. When the sizes of the userlib1 and userlib2 rows in the File Name column of the [Object File] sheet of the saved Excel book are added, you can find the size of each library. |
When building proceeds with saving of a profile and then changing of the build options, you can compare the increases or decreases of memory usage among profiles. This feature is helpful in finding build options which are optimal in terms of memory usage. For details, refer to Memory Mapping Profiler panel. |