Everything

[Task Analyzer] tab

Outline
This page is used to display and change the settings of various information required when using the task analyzer tool, which is a utility tool provided by the RI850V4, to analyze the history (trace data) of processing program execution.
This tab can be opened as follows:
- On the Project Tree panel, select a component such as the Realtime OS node or the system configuration file, and then select the [View] menu -> Property] or select [Property] from the context menu.
Note When the Property panel is already open, selecting a component such as the Realtime OS node or the system configuration file on the Project Tree panel displays the detailed information regarding the selected component.
Display image
Explanation of each area
1 ) [Trace] category
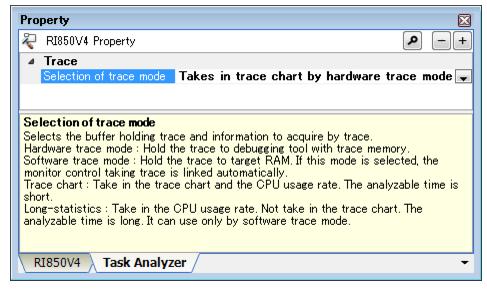
Displays and changes the settings of various information required when using the utility tool "task analyzer tool" to analyze the history (trace data) of processing program execution.
Selection of trace mode
Select the type of information to be acquired as trace data and the location where trace data is to be stored.
Default
Not tracing
How to change
Select from the drop-down list
Restriction
Not tracing
Does not use the task analyzer tool.
Taking in trace chart by hardware trace mode
Acquires information in a trace chart (such as the execution transition state of the processing program and the state of Realtime OS resource usage) and CPU usage status as trace data.
The trace buffer is allocated in the trace memory prepared by the debug tool.
Taking in trace chart by software trace mode
Acquires information in a trace chart (such as the execution transition state of the processing program and the state of Realtime OS resource usage) and CPU usage status as trace data.
The trace buffer is allocated in the area selected in [Select the buffer].
Taking in long-statistics by software trace mode
Acquires the CPU usage status as trace data.
The trace buffer is allocated in the prespecified section ".kernel_data_trace.bss".
Operation after used up the buffers
Select the operation after using up the trace buffer.
This item is displayed only when "Taking in trace chart by software trace mode" is selected in [Selection of trace mode].
Default
Continue to execution while the buffers overwriting
How to change
Select from the drop-down list.
Restriction
Continue to execution while the buffers overwriting
Overwrites the oldest trace data written to the buffer.
Stop the trace taking in
Stops writing to the trace buffer.
Buffer size
Specify the size of the trace buffer (bytes).
This item is displayed only when "Taking in trace chart by software trace mode" is selected in [Selection of trace mode].
Default
0x100
How to change
Enter directly in the text box.
Restriction
0x10 - 0xfffffffc
Select the buffer
Select the location to store trace data.
This item is displayed only when "Taking in trace chart by software trace mode" is selected in [Selection of trace mode].
Default
Kernel buffer
How to change
Select from the drop-down list.
Restriction
Kernel buffer
Allocates the trace buffer in the prespecified section ".kernel_data_trace.bss".
Another buffer
Allocates the trace buffer at the address specified in [Buffer address].
Buffer address
Specify the start address of the area to be allocated as the trace buffer.
This item is displayed only when "Another buffer" is selected in [Select the buffer].
Default
0x100
How to change
Enter directly in the text box.
Restriction
0x10 - 0xfffffff0