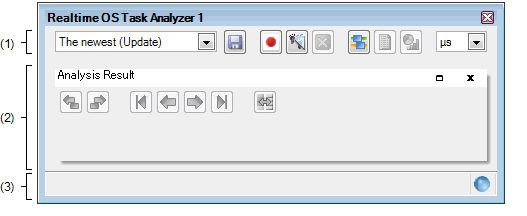
This panel displays the analysis information such as the execution transition state of the processing program, the state of real-time OS resource usage, and CPU usage status.

The following items are explained here.
This area consists of the following drop-down lists and buttons.
|
When the execution of the load module is stopped, specifies whether or not to update the analysis information displayed in the Child-panel display area, or selects the task analyzer trace data which holds the analysis information to be displayed in the Child-panel display area. |
||
|
Updates the analysis information in the Child-panel display area when the execution of the load module stops or when this item is selected. |
||
|
Does not update the analysis information in the Child-panel display area when the execution of the load module stops. |
||
|
Reads the analysis information saved as task analyzer trace data to open the Open dialog box which displays the information in the Child-panel display area. |
||
|
Displays the analysis information which has been held in the given file on the Child-panel display area. |
||
|
Opens the Save As dialog box to save the analysis information displayed in the Child-panel display area as task analyzer trace data. |
||
|
Selects whether or not to acquire trace data when the execution of the load module is started. |
||
|
Indicates that a trace start event has not been set. When the button is in this condition, trace data is not acquired when the execution of the load module is started. |
||
|
Indicates that a trace start event has been set. When the button is in this condition, trace data is acquired when the execution of the load module is started. |
||
|
Clears the analysis information displayed in the Child-panel display area. When this button is pressed, the content of the trace buffer is also cleared. |
||
|
Displays the Analysis Result panel in the Child-panel display area. |
||
|
Selects units of time when the time-related analysis information (Total Execution Time, Average Execution Time, etc.) is displayed in the Child-panel display area. |
||
This area consists of the following child-panel.
For details on this area, see section "Analysis Result panel". |
This area consists of the following bars and marks.


 /
/ 


 /
/ 

