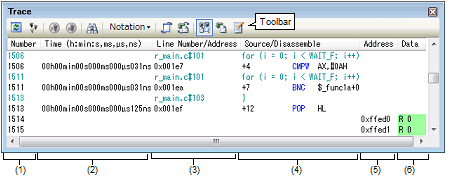
The collected trace data is displayed in the Trace panel below.
Select the [View] menu >> [Trace].
The trace data displays by mixing the disassembled text and source text by default, but it is also possible to display either one of these by selecting the Display mode.
For details on the contents and function in each area, see the section for the Trace panel.

(2): [Time (h:min:s,ms,μs,ns)] area
(4): [Source/Disassemble] area
This section describes the following.