Display the relationship between registered variable/register/address/other values and time by a graph (line chart).
Furthermore, when the selected microcontroller incorporates a Smart Analog IC [E1/E2 Lite/E20[RL78]], by enabling the Data collection modeNote on the debug tool, it is possible to display the collected data for Smart Analog by a graph.
Graphs are displayed in the Analysis Chart panel's [Variable Value Changing Chart] tab.
See the [Variable Value Changing Chart] tab for details on each of the area displayed.
This mode is the debug tool's feature that is supported only when the selected microcontroller incorporates a Smart Analog IC [E1/E2 Lite/E20[RL78]].
When the debug tool is in this mode, the data for Smart Analog can be collected while a program is executed. This mode becomes valid by performing the following setting on the debug tool's Property panel:
[Debug Tool Settings] tab >> [Smart Analog] category >> [Collect data during the execution] property >> [Yes]

A graph is displayed based on trace data or real-time RAM monitoring results acquired by the debug tool. To display a graph, see cautions of "(a) Trace function" or "(b) RRM function/RAM monitor (pseudo RRM) function". |
When Real-time sampling analysis is specified as the method for acquiring the graph data, see "3.3 Real-time Sampling Analysis". |
When Trace data analysis is specified as the method for acquiring the graph data, see "3.4 Trace Data Analysis". |
[E1/E2 Lite/E20[RL78]] |
You can change the display range of the cursor information area and channel information area by moving the splitter with the mouse. In addition, these areas can be shown/hidden by clicking the mark on the center of their splitters. |
The procedure for displaying the chart is as follows:
(a) When graphing variable/register/address/other values
(b) When graphing the data collected for Smart Analog [E1/E2 Lite/E20[RL78]]
When the [Analysis method] property in the [General] category on the [Variable Value Changing] tab of the Property panel is set to [Load from file] (i.e. when graphs are restored from the analysis chart data file (*.mtac)) |
The following types of items can be registered.
There are three ways to register graphing targets, shown below.
When the registration is completed, the name of the registered graphing target will be displayed at the Variable name check box corresponding to the channel number in the channel information area.
<1> Registering targets separately (on the Property panel)
<2> Registering targets separately (from the other panel)
<3> Reflecting the Watch panel (auto registration)
You can register graphing targets for up to 16 channels, one target per channel. |
Enter the name of the target directly from the keyboard into the [Variable/Address 1 - 16] property in the [Channel 1 - 16] category on the [Variable Value Changing] tab of the Property panel.
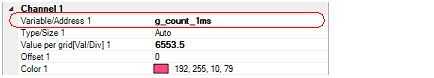
In addition, the following detailed conditions can be specified with the [Channel 1 - 16] category for each target (see “(4) Display graphs“).
To delete the registered graphing target, delete the value of the above [Variable/Address 1 - 16] property. |
The registered graphing target name is displayed at the Variable name check box on the [Variable Value Changing Chart] tab. |
From the following panel, drag and drop the target directly onto the Channel number or Variable name check box in this tab.
The name of the graphing target displayed differs depending on the type of the variable, as follows: |
Other than the above, on the Variable List panel or the Editor panel, you can also register the selected variable as a graphing target, by selecting [Register to Analysis Chart] from the context menu. |
To delete the registered graphing target, delete the value of the [Variable/Address 1 - 16] property in the [Channel 1 - 16] category on the [Variable Value Changing] tab of the Property panel. |
By clicking the [Reflect] button on the graph control area, you can automatically register watch-expressions currently being registered in the Watch panel (Watch1) as graphing targets.
Up to 16 watch-expressions in the Watch panel (Watch1), from top to bottom can be registered. If fewer than 16 watch-expressions have been registered, only the registered number are registered.
Clicking the [Reflect] button will cause the information of graphing targets being registered to be deleted (the graph being displayed will be erased). |
Categories themselves are not registered, but variables and other elements within categories are. |
If a variable has child nodes (e.g. arrays and structures), expanded variables and the like, such as structure members and array indices, are not registered. |
If a name matches a graphing target that has already registered, then it will be registered twice. |
This feature is enabled only when the selected microcontroller incorporates a Smart Analog IC.
First, set the debug tool used to the Data collection mode.
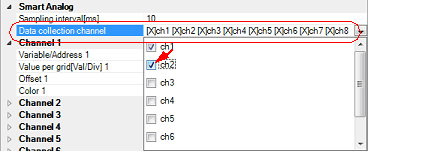
Next, specify the channel numbers in which the data is received from a device with the [Data collection channel] property in the [Smart Analog] category on the [Variable Value Changing] tab of the Property panel. In the drop-down list, select the check box of the channel number to be used (up to 8 channels can be selected).
The [Smart Analog] category appears only when the debug tool is set in the Data collection mode. |
In addition, the following detailed conditions can be specified with the [Channel 1 - 16] category on the [Variable Value Changing] tab of the Property panel for each channel (see “(4) Display graphs“).
[Variable/Address 1 - 16]: Character strings that are displayed at the Variable name check box |
There are three ways to acquire the data for graphing, as shown below.
Select the method in the [Analysis method] property in the [General] category on the [Variable Value Changing] tab of the Property panel, in accordance with the purpose.
If graph data has already been acquired, then changing this setting will cause the stored graph data to be deleted (the graph being displayed will be erased). |

|
Select [Real-time sampling] in this property. This method displays graphs based on the data acquired via the RRM function/RAM monitor (pseudo RRM) function of the debug tool (default).
If the debug tool is set in the Data collection mode, then the data will be collected using a sampling methodNote for Smart Analog. |
|||
|
Select [Analysis of trace data] in this property. This method displays graphs based on the trace data acquired via the Trace function of the debug tool. This item does not appear when any one of the following:
|
|||
|
Select [Load from file] in this property. This method restores graphs by loading the analysis chart data file (*.mtac) that have been saved (see “(6) Save the graph data to restore the graph). |
The following property setting on the Property panel is required. |
[Variable Value Changing] tab >> [Smart Analog] category >> [Sampling interval[ms]] property |
The differences depending on the method for acquiring graph data are as follows:
|
Possible when the debug tool is in any of the following states:
|
Possible when Trace function of the debug tool is enabled |
|||||
|
Not dependent on the execution timing because analysis is based on trace data |
||||||
|
Dependent on the size of the target area of RRM functionNote 2. |
If Point Trace events are used: |
|||||
|
The execution time, from the start to the end of program execution (Run-Break time) |
||||||
|
Available (see "(3) Use the trigger function") |
||||||
|
Not possible to identify accurate time/change points, because they depend on the specified sampling intervalNote 4. |
Matches actual timing (can be checked from Pop-up display) |
|||||
|
See "(a) Trace function". |
||||||
|
See "3.4 Trace Data Analysis". |
This depends on the following setting on the Property panel: |
[Variable Value Changing] tab >> [General] category >> [Chart type] property |
[E20(JTAG)[RX600 Series]] |
The number of events that can be set to "valid state" simultaneously differs depending on the microcontroller and the debug tool. For details on "Maximum number of enabled events", see "CS+ Debug Tool" of the microcontroller used. |
Debug tool's Property panel >> [Debug Tool Settings] tab >> [Access Memory While Running] category >> [Display update interval[ms]] property |
When the debug tool is in the Data collection mode [E1/E2 Lite/E20[RL78]]:
Property panel >> [Variable Value Changing] tab >> [Smart Analog] category >> [Sampling interval[ms]] property |
If you specify Real-time sampling analysis, you can control the timing with which the graph is displayed in response to the specified trigger. You can use this trigger function to display the graph with the appearance of an oscilloscope.
The trigger function can be configured in the [Trigger] category on the [Variable Value Changing] tab of the Property panel.
Your configuration contents will be listed on this tab as the trigger information.

Select whether to use the trigger function.
Select [Yes] to use the trigger function (default: [No]).
Select the trigger mode (the timing at which graphs are updated).
The sampling is stopped regardless of whether [Sync] or [Manual] is selected in the [Start/stop real-time sampling] property in the [General] category on the [Variable Value Changing] tab of the Property panel. |
Triggers are suspended while the graph is being updated in response to a trigger signal. A trigger signal received during this time will not cause the graph display to be updated. In [Auto] and [Single] modes, trigger signals are ignored while triggers are suspended. In [Normal] mode, the graph is updated in response to the latest trigger signal when trigger suspension is lifted. |
Select the variable (channel) that is the source of trigger signal.
Select a channel between ch1 and ch16 (default: [ch1]).
Specify the threshold value for determining as a trigger signal.
The variable (channel) specified for [Trigger source] determines whether a trigger signal is recognized, according to whether the value exceeds the threshold set here.
Directly enter a value with a decimal or hexadecimal number in the range "minimum trigger source" to "maximum trigger source" (floating-point decimals allowed) (default: [0]).
 ).
).Select the direction of the threshold value specified with [Trigger level].
The variable (channel) specified for [Trigger source] determines whether a trigger signal is recognized, according to whether the value exceeds the threshold in the direction set here.
|
Generates a trigger signal when the value of [Trigger source] changes from less than [Trigger level] to greater than or equal to [Trigger level] (default). |
|
|
Generates a trigger signal when the value of [Trigger source] changes from greater than [Trigger level] to less than or equal to [Trigger level]. |
|
|
Generates a trigger signal when both “Rising“ and “Falling“. |
Specify the position on the X axis for rendering the location at which the trigger signal occurred (i.e. position where the data is graphed after a trigger signal occurs).
Directly enter a value with a decimal number in the following range (default: [0s]).
Note that if the unit (s, ms, us, ns: case insensitive) is omitted, it will be handled as "ms".
 ).
).
Specify the color of the trigger marks ( /
/ ) that indicate the trigger level and the trigger position.
Specify with the color selection combo box or directly enter the value in decimal number/hexadecimal number (prefix "0x" is needed) or the color name (see "About the specification of the color") (default: [Color Orange]).
After you have executedNote and stopped the program, the latest graph for the registered graphing target is displayed (default). Note, however, that no graphs will be displayed if the corresponding data could not be acquired.
Real-time sampling analysis |
[Variable Value Changing] tab >> [General] category >> [Start/stop real-time sampling] property >> [Manual] |
Trace data analysis |
[E1/E2 Lite/E20[RL78]] |
 button on the debug toolbar to operate the debug tool in the
  button are disabled). For details on Smart Analog function, see "CS+ Debug Tool".
If the acquired graph data exceeds the buffer capacity (10000 plots), then the oldest graph data is overwritten by the new graph data (ring buffer system). |
When Real-time sampling analysis is selected, if acquiring graph data has failed, lines between transition points are not displayed but only the time information is displayed (see "(a) Graph"). |
[E1/E2 Lite/E20[RL78]] |
There are limitations to the trace memory area of the debug tool. |
The display of this graph can be configured as follows:
You can select the graph to be displayed.
In the default condition, all graphs of channels where the graphing target is being registered are displayed.
To hide a graph, clear the Variable name check box corresponding to its channel number.
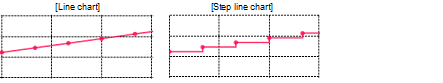
When Real-time sampling analysis is selected, you can select the chart type to be displayed.
To change the chart type, set the [Chart type] property in the [General] category on the [Variable Value Changing] tab of the Property panel (note, however, that if Trace data analysis is selected, then the chart type is fixed to [Step line chart]).
|
Creates a graph linking each plot via straight lines (default). |
|
|
Creates a graph linking each plot via perpendicular lines (step-plot chart). |
You can also specify the rendering color of a graph for each channel individually. To make the setting, set the [Color 1 - 16] property in the [Channel 1 - 16] category on the same tab. |
The graph is displayed by dividing the X and Y axes into a 10 x 10 grid.
According to the obtained graph data, optimum values are calculated for the time per unit grid (Time/Div) for the X axis and the value per unit grid (Val/Div)/offset value for the Y axis as described below (default) to display a graph.
The grids are automatically adjusted so that the specified number of value transition pointsNote on the graph fit inside the rendering area (between the left and right ends).
The grids are automatically adjusted so that the upper and lower ends of the rendering area correspond to the maximum and minimum values of the graph data, respectively.
In the default condition, 20 points are specified. This value can be changed via the [Number of transition location for auto adjustment] property in the [General] category on the [Variable Value Changing] tab of the Property panel. |
The auto adjustment function is disabled when the trigger function is used or the debug tool is set in the Data collection mode. |
The auto adjustment function becomes invalid when the following operation is performed (the [Auto adjustment] property in the [General] category on the [Variable Value Changing] tab of the Property panel will be changed to [None]). |
The [Time/Div] label or [Val/Div] label on the Analysis Chart panel is double-clicked. |
The display range is changed with the mouse operation (see "Set the display range manually"). |
The timing at which the auto adjustment is conducted can be specified with the [Auto adjustment] property in the [General] category on the [Variable Value Changing] tab of the Property panel. |
First, specify [None] with the [Auto adjustment] property in the [General] category on the [Variable Value Changing] tab of the Property panel. Then, specify the following value.
You can specify the time per unit grid for all channels. To make the setting, set the [Time per grid[Time/Div]] property, in the [General] category on the [Variable Value Changing] tab of the Property panel.
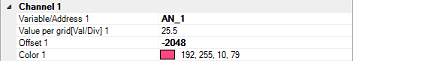
You can specify the value per unit grid or the offset value for each channel individually. To make the setting, set the [Value per grid[Val/Div] 1 - 16] property or the [Offset 1 - 16] property, in the [Channel 1 - 16] category on the [Variable Value Changing] tab of the Property panel.
You can also change the values above by any one of the following mouse operations.
Note, however, that these operations are disabled during execution of a program.
Double-clicking on the [Time/Div] label in the Analysis Chart panel has the same effect as the automatic adjustment function on the X axis. |
Double-clicking on the [Val/Div] label in the Analysis Chart panel has the same effect as the automatic adjustment function on the Y axis. |
Select a graph (the mark of transition points transforms into |
 ), and then move the mouse wheel forward or backward while holding down the [Ctrl] key.
Click and vertically drag the mouse while pressing the [Shift] key with the mouse cursor placed over any of the transition points in the graph (the mouse cursor transforms into the |
 icon).
 You can perform the following operations on the displayed graph as needed.
Check the information about transition points in the graph.
When the mouse cursor is hovered over a transition point on the graph, information about that location appears in a pop-up.
Note, however, that the content displayed will differ depending on the method for acquiring the graph data (see "(i) Pop-up display").
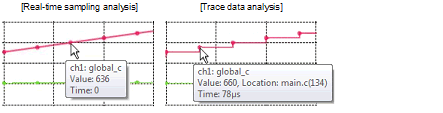
When the [Location] information is shown in a pop-up, you can display the applicable location in the Editor panel by double-clicking the transition point (except for a graph that was restored by loading the analysis chart data file (*.mtac)). |
You can check the time and value at the position of Cursor-A/Cursor-B on the graph.
You can get a cursor measurement for the X axis (time) or Y axis (value).
Measurements appear in a list in the cursor information area on this tab (see "(4) Cursor information area").
To perform this measurement, first use the cursor selection button ([X axis (Time)] button/[Y axis (Value)] button) to select the target axis to measure. Then, set Cursor-A and Cursor-B to the desired location on the graph by using the following operations (the cursors are hidden by default).
You can change the color of each cursor via the [Cursor-A color]/[Cursor-B color] property in the [General] category on the [Variable Value Changing] tab of the Property panel. |
You can zoom in on any location on the graph.
In the graph control area, select the zoom 1 - 4 check boxes (multiple selections allowed) to open the Variable Value Changing Chart (zoomed in) panel for the checked number(s), and view the specified range in a zoomed display (you can open up to four Variable Value Changing Chart (zoomed in) panels).
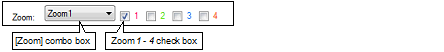
To set the zoom range, select the number of the Variable Value Changing Chart (zoomed in) panel in the [Zoom] combo box, then click and drag with the mouse to select the zoom area. During this time, you can reset the zoom range by using the same operation, as long as Zoom frame appears indicating the drag region displayed on the graph.
To cancel the zoom range setting, press the [ESC] key during dragging.
To clear the set range, double-click somewhere in the graph area (a transition point is not included).
See the Variable Value Changing Chart (zoomed in) panel for details on zoomed views.
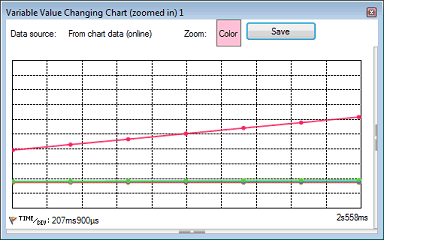
You can set separate zoom ranges for each of four Variable Value Changing Chart (zoomed in) panel views. |
You can change the color of each zoom frame via the [Zoom-1 - 4 color] property in the [General] category on the [Variable Value Changing] tab of the Property panel. |
You can restore the graph currently being displayed by loading the analysis chart data file (*.mtac) which saves the data of the graph.
The procedure for restoring the graph is as follows:
For the graph on the [Variable Value Changing Chart] tab |
For the graph on the Variable Value Changing Chart (zoomed in) panel |
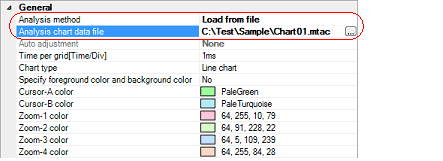
On the [Variable Value Changing] tab of the Property panel, select [Load from file] in the [Analysis method] property in the [General] category (see “(2) Specify the method for acquiring the graph data“).
Then, specify the analysis chart data file (*.mtac) that was saved previously with the [Analysis chart data file] property in the same category.
At this time, data items to be saved/restored are as follows:
[Values of properties on the [Variable Value Changing] tab in the Property panel]
|
[Channel 1 - 16] category >> [Variable/Address 1 - 16] property |
|
|
[Channel 1 - 16] category >> [Value per grid[Val/Div] 1 - 16] property |
|
|
[Smart Analog] category >> [Sampling interval[ms]] property Note that saving is possible only when the selected microcontroller incorporates a Smart Analog IC and the debug tool has collected graph data in the Data collection mode. |
Channels without graph data are not saved, regardless of whether the graph is visible. In this case, the default values of the properties for that channel are applied. |
See "2.14 Save Analysis Information" for details about saving graph data for purposes other than restoring graphs. |