To set a Trace event, set a trace start event and a trace end event that starts/stops collecting the trace data.
Use one of the following methods to set a trace start event and a trace end event.
By setting execution-related events for a trace start event and a trace end event, it is possible to start and stop the collection of trace data at any place.
Perform this operation in the Editor panel/Disassemble panel in which the source text/disassembled text is displayed.
Follow the operation listed below from the context menu, in accordance with your desired event type, after moving the caret to the target line that has a valid address.
[Simulator] |
A trace start event or a trace end event is set to the instruction at the start address corresponding to the line of the caret position. Once a trace start event or a trace end event is set, the following event mark is displayed in the event area of the line/address that an event is set.

[Full-spec emulator][E1][E20] |
By setting access-related events for a trace start event and a trace end event, it is possible to start and stop the collection of trace data when a specified access is made to any variable or IOR.
The types of access that can be set by using methods described here are only a read/write (see "Table 2.8 Types of Accesses to Variables"). |
Perform this operation in the Editor panel/Disassemble panel in which the source text/disassembly text is displayed.
Follow the operation listed below from the context menu, in accordance with your desired event type, after selecting an arbitrary variable or IOR on the source text/disassembled text.
Note, however, that only global variables, static variables inside functions, and file-internal static variables can be used.
|
Select [Trace Settings] >> [Record Start R/W Value], and then press the [Enter] key. |
|
|
Select [Trace Settings] >> [Record End R/W Value], and then press the [Enter] key. |
At this time, if you have specified a value in the text box in the context menu, collection of trace data is started or finished only when a read/write is performed with a specified value. If no value is specified, collection of trace data is started or finished when a read/write is performed to the selected variable or IOR, regardless of the value.
Variables or SFR at lines that have no valid addresses cannot be used for trace start events and trace end events. |
Perform this operation in the Watch panel.
Follow the operation listed below from the context menu after selecting the registered watch-expression (multiple selections not allowed). Note, however, that only global variables, static variables inside functions, file-internal static variables, and IOR can be used.
|
Select [Trace Output] >> [Record Start R/W Value], and then press the [Enter] key. |
|
|
Select [Trace Output] >> [Record End R/W Value], and then press the [Enter] key. |
At this time, if you have specified a value in the text box in the context menu, collection of trace data is started or finished only when a read/write is performed with a specified watch-expression. If no value is specified, collection of trace data is started or finished when a read/write is performed to the selected variable or IOR, regardless of the value.
A watch-expression within the current scope can be specified. |
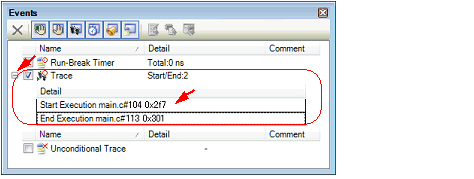
When a trace start event and a trace end event are set, they are managed collectively on the Events panel as one instance of a Trace event (see "2.19 Manage Events"). When you click the "+" mark at a Trace event item, detailed information on the trace start event and the trace end event you have set is displayed.

If either one of a trace start event and a trace end event is set as Valid state, the check box of Unconditional Trace event in the Events panel is automatically cleared, therefore, trace data collection does not automatically start with the start of the program execution (the tracer will not run until the condition of the trace start event that has been set is met). |
Event marks differ depending on the event state (see "2.19.1 Change the state of set events (valid/invalid)"). |
[Simulator] |


 ) is displayed meaning more than one event is set at the point.