This panel is used to display the detailed information about the events that are set on the Editor panel/Disassemble panel/Watch panel. On this panel, you can change the setting state of the event between valid/invalid and delete the event (see "2.19 Manage Events").
This panel appears only when connected to the debug tool.
Also see "2.19.7 Notes for setting events" for details on events (e.g. limits on the number of enabled events). |
Events set via the Function List panel or Variable List panel of the analyze tool (Program Analyzer) are also managed on this panel. |
This panel can be zoomed in and out by |
 in the tool bar, or by moving the mouse wheel forward or backward while holding down the [Ctrl] key.
When the separator line of each area in this panel is double-clicked, the width of the area changes to the shortest possible size that can display the contents of the area. |
This section describes the following.
[Simulator] |
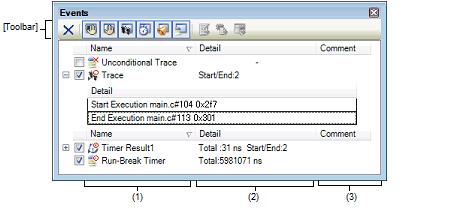
A list of the event names that have currently been set is displayed in the form shown below.
It is possible to limit the event to be displayed by clicking the button on the toolbar (see "[Toolbar]"). |
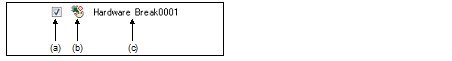
The setting state of the event is displayed/changed.
Note that the Event mark is changed depending on the setting state of the event.


Both of the Timer Start event and Timer Stop event is must be set for the Timer Result event. Therefore, it is not possible to set a particular event to a valid state by only the setting of one of these (at the same time as both events are set, they are treated as grouped events as a Timer Result). |
The setting of the Unconditional Trace event and the Trace event to valid or invalid state is exclusively controlled. Therefore, the Unconditional Trace event, which is a built-in event, is valid state by default, but if either a trace start event/trace end event is set, it automatically becomes invalid state, and the Trace event, which is a event name that is collectively called with a trace start event and a trace end event, becomes valid state. Conversely, if the set Trace event is invalid state, the Unconditional Trace event automatically becomes valid state. |
The event mark shows the type of event, and in addition shows the current setting state.
The meanings of the marks displayed are as follows:
|
Displayed on only the Events panel |
|||||
|
Displayed on only the Editor panel/Disassemble panel |
|||||
|
Displayed on only the Events panel |
|||||
|
Displayed on only the Editor panel/Disassemble panel |
|||||
|
Displayed on only the Events panel |
|||||
|
Displayed on only the Editor panel/Disassemble panel |
|||||
|
Displayed on only the Editor panel/Disassemble panel |
|||||


The event type and ID number are displayed as the event name.
A number from 0001 is automatically provided as the ID number for each event (no renumbering of the ID number is done even in the event that an event that has been set once is deleted).
Event types that are displayed are as follows:
|
Breaks the program when the condition is met while the debug tool monitors the break condition all the time during program execution. -> See "2.11.3 Stop the program at the arbitrary position (breakpoint)" -> See "2.11.4 Stop the program at the arbitrary position (break event)" -> See "2.11.5 Stop the program with the access to variables/I/O registers" |
||
|
Breaks the program when the instruction, which an address code to break is rewritten for the break instruction, is executed. -> See "2.11.3 Stop the program at the arbitrary position (breakpoint)" |
||
|
This event type is a Hardware Break (execution type) that is set in the Function panel of the analyze tool (Program Analyzer). |
||
|
This event type is a Hardware Break (access type) that is set in the Variable panel of the analyze tool (Program Analyzer). |
||
|
Automatically collects the trace data with start of a program execution, and stops collecting the trace data with stop of the program execution. This event cannot be deleted because of the built-in eventNote 2 (this event is set to a Valid state by default). -> See "2.14.2 Collect execution history until stop of the execution" |
||
|
Automatically measures the execution time of a program with start of the program execution, and stops the measurement with stop of the program execution. This event cannot be deleted because of the built-in eventNote 2 (this event is set to a Valid state by default). -> See "2.15.1 Measure execution time until stop of the execution" |
||
|
Starts/stops collecting the trace data when the condition specified with a trace start event and a trace end event is met (this event is displayed when either a trace start event or a trace end event is set). |
||
|
Starts/stops measuring the execution time of a program when the condition specified with a timer start event and a timer end event is met (this event is displayed when either a timer start event or a timer end event is set). "n" indicates the channel number in which a Timer Result event is set. |
||
|
Starts/stops performance measurement when the condition specified with a performance measurement start event and a performance measurement end event is met (this event is displayed when either a performance measurement start event or a performance measurement end event is set). "n" indicates the channel number in which a Performance Measurement event is set. |
||
|
Records the information as the trace data only when accessing the specified variable or I/O register during execution of a program. -> See "2.14.4 Collect execution history only when the condition is met" |
||
|
Executes printf command in software processing after temporary stopping a program in execution at an arbitrary position (action event). -> See "2.18.1 Inset printf" |
||
A breakpoint that is set by a one click operation of the mouse is displayed "Break" (see "2.11.3.1 Set a breakpoint"). |
Detailed information about each event is displayed.
The contents of the information that is displayed differ depending on the event type as follows:
|
If the microcontroller is multi-core, the core name is shown. If the microcontroller is single-core, nothing is shown. |
|||
|
Displays one of the following conditions. Execution: Before Execution or After Execution Access: Before Read, After Read, Before Write, After Write, Before Read/Write, After Read/Write |
|||
|
Shows the line number of the source. Display format is the same as the watch type scope specification expression. When multiple load module files are downloaded, <Load module file name$File name#Line number> is displayed. For those events set in the Disassemble panel, display <Line number> in the format <Symbol + offset> in the condition below.
|
|||
|
Shows the variable name in the source file. Display format is the same as the watch type scope specification expression. |
|||
|
Condition to compare (==) is shown. If the comparison value is not specified, comparison condition is not shown. |
|||
|
Comparison value is shown. If the comparison value is not specified, comparison condition is not shown. |
|||
|
Shows whether the contents of the detailed information is start event or the stop event. |
|||
|
Shows the measurement result of the pass count of the timer. If a timer overflow occurs (see "2.15.3 Measurable time"), or if the illegal value was acquired, "OVERFLOW" is displayed. If measurements have not been performed yet, "Not measured" is displayed. |
|||
|
Shows the measurement result of the timer total execution time. The unit is either of ns/μs,/ms/s/min/clock (if, however, the unit is in "min", a value in "s" unit also appears). If a timer overflow occurs (see "2.15.3 Measurable time"), or if the illegal value was acquired, "OVERFLOW" is displayed. If measurements have not been performed yet, "Not measured" is displayed. |
|||
|
Shows the measurement result of average execution of the timer. The unit is either of ns/μs,/ms/s/min/clock (if, however, the unit is in "min", a value in "s" unit also appears). If a timer overflow occurs (see "2.15.3 Measurable time"), or if the illegal value was acquired, "OVERFLOW" is displayed. If measurements have not been performed yet, "Not measured" is displayed. |
|||
|
Shows the measurement result of the maximum execution time of the timer. The unit is either of ns/μs,/ms/s/min/clock (if, however, the unit is in "min", a value in "s" unit also appears). If a timer overflow occurs (see "2.15.3 Measurable time"), or if the illegal value was acquired, "OVERFLOW" is displayed. If measurements have not been performed yet, "Not measured" is displayed. |
|||
|
Shows the measurement result of the minimum execution time of the timer. The unit is either of ns/μs,/ms/s/min/clock (if, however, the unit is in "min", a value in "s" unit also appears). If a timer overflow occurs (see "2.15.3 Measurable time"), or if the illegal value was acquired, "OVERFLOW" is displayed. If measurements have not been performed yet, "Not measured" is displayed. |
|||
|
Shows the variable expression and the character strings specified in the Action Events dialog box. |
|||
|
Shows the mode of performance measurement. The mode set in the Detailed Settings of Performance Measurement dialog box [Full-spec emulator][E1][E20] is displayed. |
|||
|
Shows the result of performance measurement. If "Clock cycle", "Non-interrupt cycle", or "Interrupt disable cycle of DI/EI" is set as the performance measurement mode in the Detailed Settings of Performance Measurement dialog box [Full-spec emulator][E1][E20], the number of cycles is displayed, otherwise the number of counts is displayed. |
The user can write comments for each event that has been set.
To input comments, click on this area, or select [Edit Comment] form the context menu after selecting the event in which you want to input comments, and then input directly the desired text from the keyboard (the edit mode is cancelled by pressing down the [Esc] key).
After editing the comments, complete the editing by pressing the [Enter] key or moving the focus to outside the edit region. Up to a maximum of 256 characters can be inputted for the comments, and this is saved as the settings of the user during use.
|
Deletes the selected event and event condition. Note that it is not possible to delete the built-in events (Unconditional Trace event and Run-Break Timer event). |
||
|
Displays events related to performance measurement (default). |
||
|
Displays events related to the action event (Printf event) (default). |
||
|
Displays events related to the built-in event (Unconditional Trace event/Run-Break Timer event) (default). |
||
|
Opens the Editor panel and jumps to the source line corresponding to the address where the selected eventNote is being set. |
||
|
Opens the Disassemble panel and jumps to the disassemble results corresponding to the address where the selected eventNote is being set. |
||
|
Opens the Memory panel and jumps to the memory corresponding to the address where the selected eventNote is being set. |
||


Events other than Trace events, Timer Result events and built-in events (Unconditional Trace events/Run-Break Timer events) can be objects of this button. |
[[Edit] menu (Events panel-dedicated items)]
The following items are exclusive for [Edit] menu in the Events panel (all other items are disabled).
|
Enables the selected event (valid state). Note that this item is disabled if the selected event is a valid state. |
||||
|
Disables the selected event (invalid state). Note that this item is disabled if the selected event is an invalid state. |
||||
|
Note that it is not possible to delete the built-in events (Unconditional Trace event and Run-Break Timer event). |
||||
|
The following cascade menus are displayed to limit the event type to be displayed. |
||||
|
Displays events related to built-in events (Unconditional Trace event or Run-Break Timer event). |
||||
|
The following cascade menus are displayed to do the settings related to the timer. Note that this item is enabled only when a timer-related event has been selected. |
||||
|
Initializes the timer used by the selected event (except for Run-Break Timer). |
||||
|
Displays the result of a selected event measured by a timer in nanosecond (ns) units. |
||||
|
Displays the result of a selected event measured by a timer in microsecond (μs) units. |
||||
|
Displays the result of a selected event measured by a timer in millisecond (ms) units. |
||||
|
Displays the result of a selected event measured by a timer in second (s) units. |
||||
|
Displays the result of a selected event measured by a timer in minute (min) units. |
||||
|
Displays the result of a selected event measured by a timer in clock units. |
||||
|
Initializes performance measurement used by the selected event. |
||||
|
Opens the Memory panel (Memory1) and jumps to the memory corresponding to the address where the selected eventNote is being set. |
||||
|
Opens the Disassemble panel (Disassemble1) and jumps to the disassemble results corresponding to the address where the selected eventNote is being set. |
||||
|
Opens the Editor panel and jumps to the source line corresponding to the address where the selected eventNote is being set. |
||||
|
Opens one of the following dialog box to edit the selected event
|
||||
|
Sets to the edit mode to input comments for the selected event. When comments are already present, all of that character string is set to a select state. |
||||
Events other than Trace events, Timer Result events and built-in events (Unconditional Trace events/Run-Break Timer events) can be objects of this item. |