With hot plug-in function, you can connect the debug tool to the CS+ and debug the program while it is in execution.
Follow the steps below to establish hot plug-in connection.
Execute the program which has been downloaded onto the microcontroller on the target system without connecting to the emulator.
In the active project, specify the debug tool which supports hot-plug in connection ([E1(JTAG)]/[E20(JTAG)]).
Select [Hot Plug-in] from [Debug] menu to initiate the preparation for hot plug-in connection.
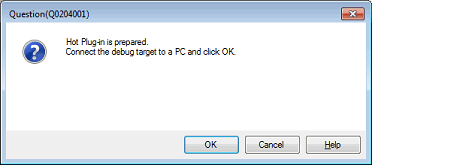
Following message will appear once you are ready to start hot plug-in connection. Connect the emulator to the target system and click [OK]. This will start the communication with the debug tool which is selected in the currently active project.

[E1(JTAG)] |
Once the connection to the debug tool is successfully completed, the Status bar on the Main window will change as shown below. For details on each item displayed on the Status bar, see the section of the "Main window".

The trace function will not be available until the program breaks following the completion of hot plug-in connection. |
The real-time RAM monitor function (RRM function) will not be available until the program breaks following the completion of hot plug-in connection. Do not select [Real-time RAM monitor] for the [Usage of trace function] property under the[Trace] category. |
Once the hot plug-in connection is established, all the events that have been set in the project as the user information (excluding built-in event) will be deleted. |
When conducting hot plug-in connection, do not use a project for which software break point is set as it may result in unsuccessful connection. Check that all the software break points are deleted in the Events panel of the active project before starting hot plug-in connection (see 2.17.5 Deleting events). |
The emulator stops the program temporarily for approximately 800s to check the ID code at hot plug-in connection (CPU clock: 100 MHz, JTAG clock: 16.5 MHz). |
[RX630, RX631, RX63N, and RX63T Groups] |