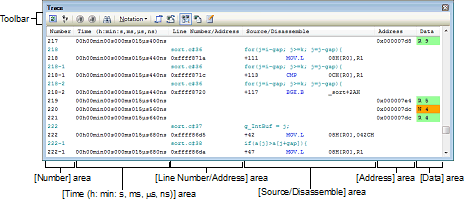
To display the collected trace data, use the Trace panel shown below.
Choose [Trace] from the [View] menu.
The trace data is displayed, by default, in a disassembled text and source text mixed mode. By selecting the appropriate Display mode, it is possible to display either of the two.
For details on how to read each area and about their functionality, see the section where the Trace panel is described.

This section describes the following.
2.13.6.1 Changing the display mode