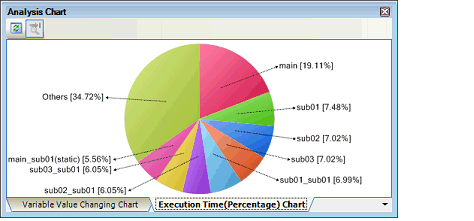
Display a pie chart of the function execution time ratios.
The chart is displayed in the Analysis Chart panel's [Execution Time(Percentage) Chart] tab, based on the currently acquired Dynamic analysis information (equivalent to [Execution Time(Percentage)[%]] in the Function List panel).
See the [Execution Time(Percentage) Chart] tab for details on each of the area displayed.

When the debug tool to use does not support the Trace function, or when the debug tool's trace function is not enabled, this chart cannot be displayed. |
To display this chart, see cautions of "(a) Trace function". |
[E1/E2 Lite/E20[RX]][EZ Emulator[RX]] |
[E1/E2 Lite/E20[RX]][EZ Emulator[RX]] |
The following operations can be performed on the call graph displayed.
You can change the number of functions displayed in the chart.
To do this, specify the number in the [The number of functions displaying in the Execution Time(Percentage) Chart] property in the [Analysis Chart] category on the [Settings] tab of the Property panel (set to [10] by default).
The targets are graphed in ranking order of highest proportion of execution time taken. Functions exceeding the number specified here are displayed together under "Others".
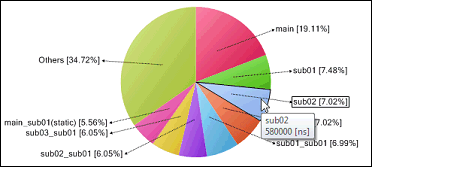
When the mouse cursor is hovered over a function, information about that function's execution time appears in a pop-up.

The display contents are updated each time program execution is stopped. |