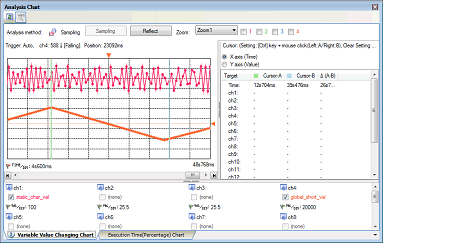
You can display the acquired function information and variable information (including the data information for Smart AnalogNote) in a chart.
To display a chart, click the  button on the Main window's toolbar to open the Analysis Chart panel.
The following content is graphed in the Analysis Chart panel.
[E1/E2 Lite/E20[RL78]] |
