In the [Debug Tool Settings] tab, you configure the basic settings of the debug tool for each one of the following categories.
(2) [Access Memory While Running]
(4) [E2 Expansion Interface] [E2]
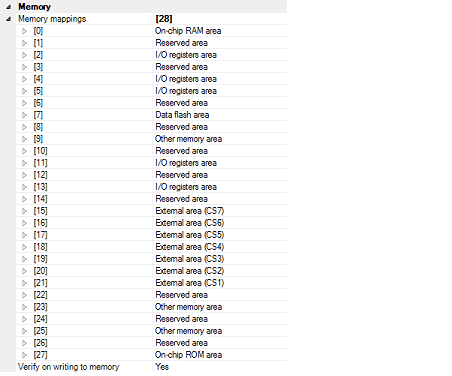
You can configure the memory in this category.

Current memory mapping status is displayed for each type of memory area.
It is not possible to change mapping on this panel.
To add or delete an I/O protection area, select the [Memory mappings] property and click on the [...] button that appears on the right to open the Memory Mapping dialog box. For details on how to change settings, refer to the section of the Memory Mapping dialog box.
This property displays only the number of memory areas.
Expanding the [Memory mappings] property will display the following sub-items.
Indicates the memory type of the corresponding area.
Each memory type corresponds to the following areas.
|
Address range in an external area that is not read by the debugger. Register this area in the Memory Mapping dialog box. |
If data in the on-chip flash ROM area is changed by means other than downloading (e.g. by manipulating it via the Memory panel or line assembling), the flash ROM reflects this change next time the user program is run. |
If an attempt is made to reference data in erased data flash ROM, only undefined values are displayed due to the specifications of the microcontroller. If the debugger is used to write to the data flash ROM, on the other hand, data is written in 256-byte units. Written areas do not hold undefined values. |
Do not use the debugger to write to FCU-RAM. The FCU firmware area also cannot be written by the debugger. |
[RX71M, RX66x, RX65x, and RX64M Groups] |
[Access width[bits]] |
[Endian] |
Connecting to a debug tool (see "2.4.1 Connect the debug tool to CS+") will display details for each memory type. |
Specify whether to perform a verify check when the memory value is initialized from the drop-down list.
Select [Yes] to perform verification after download or when values are changed in the Watch panel/ Memory panel.
You can configure the memory access while executing a program in this category.
The settings of this category are required when using the real-time display update function. See "2.11.1.4 Displaying and changing memory contents during program execution" for details on the real-time display update function.

Specify from the drop-down list whether to allow access to the memory area while executing a program.
Select [Yes] to allow access ([No] is selected by default).
Specify whether to update the display in the Watch panel/Memory panel while executing a program.
Select [Yes] to update the display (default).
This property is displayed only when the [Update the display during execution] property is set to [Yes].
Specify the interval in 100ms unit to update the contents in the Watch panel/Memory panel display while executing a program.
Directly enter the Integer number between 100 and 65500 (rounding up the fractions less than 100ms) ([500] is specified by default).
Note that if you've changed the specified value of the [Update the display during execution] property from [No] to [Yes], the previous set value is displayed in this property.
In this category, make settings related to PC display in the Status bar during program execution.

This property specifies whether the PC value is displayed in the Status bar during program execution.
When you select [No], the Status bar under execution will show "Running."
[RX100 Series] |
This property is displayed only when you've selected [Yes] in the [PC display during the execution] property.
During program execution, specify a PC display updating interval in the Status bar in 100 ms units.
Enter an integer directly in the range 100 to 65500 (with fractions below 100 ms rounded up). (By default, [500] is specified.)
Note that if you've changed the specified value of the [PC display during the execution] property from [No] to [Yes], the previous set value is displayed in this property.
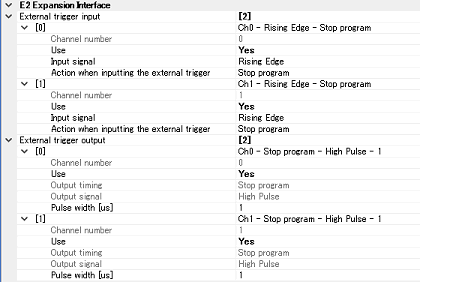
You can configure the E2 Expansion Interface.

Set the settings related to the external trigger input.
You can select different actions for each channel.
The channel number is displayed.
Specify whether to use the external trigger input for this channel number.
The action when inputting the external trigger is displayed.
Set the settings related to the external trigger output.
You can select different actions for each channel.
The channel number is displayed.
Specify whether to use the external trigger output for this channel number.
The output timing is displayed.
You can configure the break function in this category.

Specify from the following drop-down list the type of preferential breakpoint to be used with a single click of the mouse in the Editor panel/Disassemble panel.
When setting a break point after the preferential break point type has been used up, the other break point type will be automatically selected.
See "2.10.2 Stop the program at the arbitrary position (breakpoint)" for details on breakpoints.
You can configure the emulation system in this category.
For more information regarding the execution of a specified routine before the execution and after the break of a program, see "2.9.4 Execute a specified routine [E1] [E20] [EZ Emulator]".

Specify whether to debug programs that rewrite on-chip program ROM area, such as those that use ROM P/E mode.
Specify whether to debug programs that rewrite on-chip data flash area, such as those that use data flash P/E mode.
Specify whether to execute a specified routine before executing the user program.
Specify the address to be executed immediately before the user program execution. This property is displayed only when [Execute the specified routine immediately before execution of the user program] property is set to [Yes].
Specify whether to execute a specified routine after the user program break.
Specify the address to be executed immediately after the user program break. This property is displayed only when [Execute the specified routine immediately after the user program stops] property is set to [Yes].
Specify the address where the work RAM for use in execution of the specified routine starts. Specify an address value that is a multiple of four bytes. If the entered value is not a multiple of four bytes, the value is automatically corrected. The amount of memory indicated by the [Work RAM size [bytes] for executing a specified routine] property beginning with this address is to be used by the debugger firmware.
This property is displayed only when you have selected [Yes] either for the [Execute the specified routine immediately before execution of the user program] or [Execute the specified routine immediately after the user program stops] property.
Indicates the size of the work RAM for use in execution of the specified routine.
This property is displayed only when you have selected [Yes] either for the [Execute the specified routine immediately before execution of the user program] or [Execute the specified routine immediately after the user program stops] property.
You can configure the trace function in this category.

[Trace] is displayed as the usage of trace function.
You cannot change the value of this property.
Select the trace acquisition mode from the following drop-down list.
|
Continues overwriting the older trace data after the trace memory is full. |
|
|
Stops writing the trace data after the trace memory is full. |
|
Select the type of data for which trace is to be acquired from the drop-down list.
The type of data that can be selected differs depending on the series of the microcontroller.
Following data types are displayed in the drop-down list.
Branch, Branch + Data access, Data access
This property is displayed only when [Branch + Data access] or [Data access] is specified in the [Trace data type] property.
Select the Bus master of data access from the drop-down list.
The following bus masters are displayed in the drop-down list.
For data access tracing, only the trace results of data access from the specified bus master are displayed on the trace panel.
For an microcontroller that does not have the function for selecting the Bus master of data access, the [Bus master of data access][RX71M, RX66x, RX65x, and RX64M Groups] property is not displayed. In this case, the bus master is fixed to [CPU]. |
Specify whether timestamp information is added to the trace data to be collected.
The change options in this property vary depending on the microcontroller series and the specified value of [Trace data type] property, as follows:
This property is displayed only when you've specified [Yes] in the [Output timestamp] property.
Enter a count source with which a timestamp value is calculated from a count value.
To specify this, enter a value directly in the range 0.0001 to 999.999.
Note that if this property is blank, the set value of the [Operating frequency [MHz]] property in the [Clock] category of a [Connect Settings] tab is used in place of the count source.
The property's set value is not reflected in the trace data that has already been collected. The property you've set is reflected beginning with the trace data that is collected after it is set. |
This property is displayed only when [Yes] is selected in the [Output timestamp] property.
Select the frequency division ratio for the timestamp count source from the drop-down list.
The following frequency division ratios are displayed in the drop-down list.
The frequency specified in the [Trace clock count source[MHz]] property is divided by the specified value (the frequency is multiplied by 1/n) and one cycle of the obtained frequency is used as the unit for timestamp count (the frequency for count value 1).
For an microcontroller that does not have the function for dividing the timestamp frequency for tracing, the [Division ratio of trace clock count source][RX71M, RX66x, RX65x, and RX64M Groups] property is not displayed. In this case, the division ratio is fixed to [1/1]. |
You can configure the timer function in this category.

Specify whether to use two 32-bit counters or one 64-bit counter.