Basic Method for Analyzing Control Quality Analysis

Next, let us try using the Variable Value Changing Chart analysis graph in order to familiarize ourselves with actual analysis of control quality.
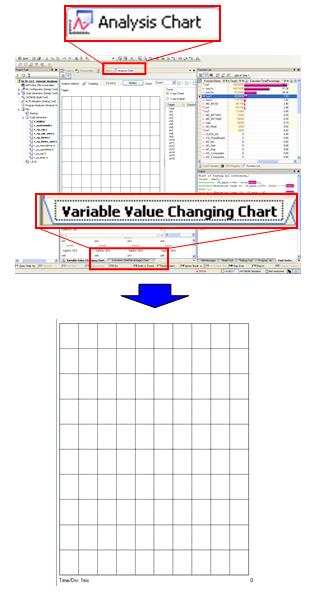
Follow the steps below to open Analysis Graph panel, and open the "Variable Value Changing Chart" tab.
|
Make Analysis Chart active, and click on the "Variable Value Changing Chart" tab. |

|
[Variable Value Changing Chart] appears in Analysis Chart . But now graphs are not described. |
In order to familiarize ourselves with analysis of control quality, we will return the trace-function settings for our sample project to their original values. Follow the steps below to configure the project to not use the trace function.
|
In the main window, click the [Trace] icon. |


|
The [Trace] icon changes, and the simulator is configured to not use the trace function. |
Here, how changes in actual values are displayed is demonstrated.
Check the changes in the values of data1 and data2 in the sample program.
A brief explanation of the variables used in this example is provided here.
Data1 is a global variable obtained by adding data2 and reg_1ms.
Data2 is a global variable which counts up by one every 10 ms in response to an interrupt from an interval timer. Note, however, that data2 returns to 0 when it reaches 20.
reg_1ms is a global variable which counts up by one every 1 ms in response to an interrupt from an interval timer. Note, however, that reg_1ms returns to 0 every 10 ms in response to an interrupt from an interval timer.
Let us now check the actual trends of these variable values in an analysis graph. To register variables in the analysis graph, you can enter the name of the variable directly, but it is more convenient to create a link to the watch panel, so we will describe this method here.
As shown below, register the variables data1 and data2 to Watch 1.
|
Select the variables data1 and data2 in the editor, and register them to Watch 1. |


|
"data1" and "data2" are registered in Watch Panel 1. |
As shown below, link Watch 1 to Analysis Chart . Click the icon to link the watch panel as shown below. data1 and data2 appear.
|
Click the icon to link Analysis Chart with Watch 1. |


|
data1 and data2 appear in Analysis Chart . |
You are now ready to create the graph. Try running the program.
|
From the menu, click the [Reset & Run] button. Next, click [Stop]. |


|
data1 and data2 appear in Analysis Chart as a line chart. |
You can also display the variable value and time by hovering your mouse cursor over the graph plot, as shown below.
