Method of Trace-data Analysis

Next, let us try using the trace-data analysis method.
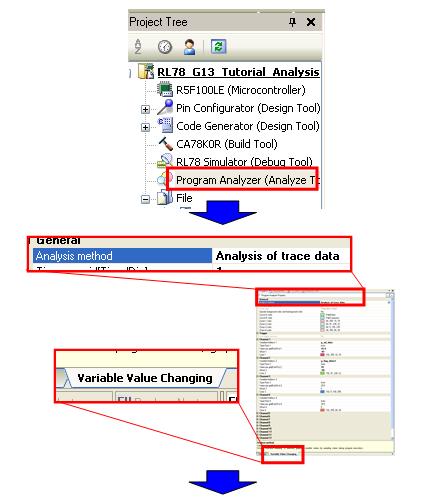
This method creates a plot on the graph by tracing through the history of changes to variables made by the CPU. In this section, we will describe this trace data briefly.
The figure below shows the Trace panel. When you use the trace function, this panel appears when you select [View] -> [Trace] from the menu. As shown in the figure, the analysis graph showing the Variable Value Changing Chart only uses time and access information.

We also used the trace data to analyze the functions' execution ratios, but it was necessary to choose an appropriate method in accordance with the target of analysis, because we do not have a very large trace-memory capacity. The same applies for variable-trend analysis as well.
Here, we will describe the method for acquiring the greatest amount of variable-trend data possible. In this method, we use point tracing to acquire only time and access information as the trace data.
Configure the trace function as shown below.
|
Configure the function to use tracing, and set point tracing for data1 and data2. Next, configure the tracing event. |


|
Point tracing for data1 and data2 is set in the Event panel. |
Next, let us try using the trace-data analysis method.
|
In Analysis Chart 1, click the Trace Data Analysis icon, and run the program. Next, stop program execution. |


|
A line chart appears in the analysis graph panel, using the Trace Data Analysis method. |


You can see here that unlike the real-time sampling method, the line on the graph is in steps. This is because you can plot all changes to variables, because you are using trace data as the source.