You can display a tree-structured chart (call graph) that represents calling relationships between functions in the program based on the acquired function information.
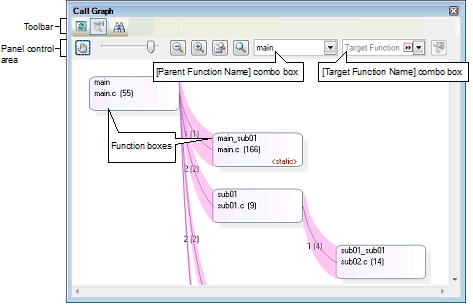
The latest call graph that can currently be displayed (see "1.1.2 Types of analysis information") is displayed on the following Call Graph panel, which is opened by clicking the  button on the Main window's toolbar.
Note, however, that the function information and variable information in the files not to be analyzed is not displayed in this panel (see "1.1.1 What is analyzed").
See the Call Graph panel for details on the call graph displayed.

If the debug tool to use does not support the trace function, or if the debug tool's trace function is not enabled, then the Dynamic analysis information (e.g. the execution count/read count/write count) in the call graph cannot be displayed. |
[CC-RX] |
The following operations can be performed on the call graph displayed.
By default, the first function to appear named "main" [RH850][RL78]/"reset"[RX] or containing such word is considered to be the parent function, and that function is placed on the left edge of the call graph in a box format (function box).
Select a function from the drop-down list of the [Parent Function Name] combo box to change the parent function to be displayed in call graph.
[RH850] |
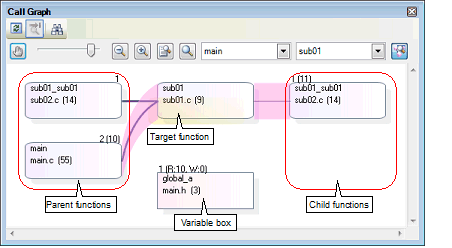
By clicking the  button on the panel control area, the call graph is switched to Details view that displays the parent functions and child functions of the function currently being specified with the [Target Function Name] combo box.
In the details view, when global variables, static variables inside a file or static variables inside a function accessed from the target function exist, these variables are also displayed as variable boxes.
To switch to Whole view (default), click the  button again.

By double-clicking on a function box/variable box in the call graph, you can jump to the location of the source text where that function/variable is defined (see "2.7 Jump to Defined Location").
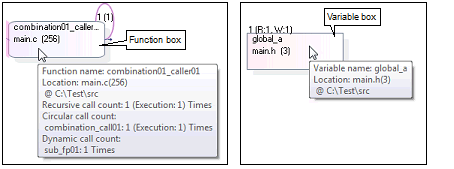
When the mouse cursor is hovered over a function box/variable box in the call graph, information about that function/variable appears in a pop-up.
This function cannot be used while scrolling via the mouse dragging is being enabled by the |

You can search for an arbitrary function/variable existing in the call graph.
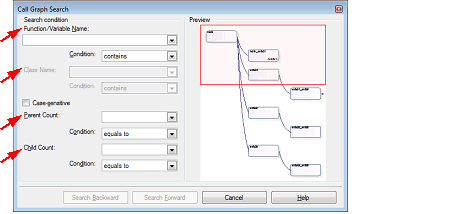
To do this, click the  button on the Call Graph panel's toolbar to open the Call Graph Search dialog box.
In this dialog box, follow the steps below.

Specify a function name/variable name to search.
You can either type character strings directly into the text box (up to 2046 characters), or select one from the input history via the drop-down list (up to 10 items).
Next, to specify conditions for the specified character strings, select the desired conditions in the [Condition] combo box ([contains] is selected by default).
Searches are case-insensitive if the [Case-sensitive] check box is selected.
Drag and drop an arbitrary row of the Function List panel/Variable List panel to this area. |
If required as a search parameter for a function/variable, you can specify the class name to which a member function/member variable to search belongs.
You can either type character strings directly into the text box (up to 2046 characters), or select one from the input history via the drop-down list (up to 10 items).
Next, to specify conditions for the specified character strings, select the desired conditions in the [Condition] combo box ([contains] is selected by default).
Searches are case-insensitive if the [Case-sensitive] check box is selected.
If required as a search parameter for a function, you can specify the number of parent functions to search.
You can either type a value directly into the text box (settable range: 0 to 65535), or select one from the input history via the drop-down list (up to 10 items).
Next, to specify conditions for the specified value, select the desired conditions in the [Condition] combo box ([equals] is selected by default).
If required as a search parameter for a function, you can specify the number of child functions to search.
You can either type a value directly into the text box (settable range: 0 to 65535), or select one from the input history via the drop-down list (up to 10 items).
Next, to specify conditions for the specified value, select the desired conditions in the [Condition] combo box ([equals] is selected by default).
When the [Search Backward] button is clicked, the search uses the specified conditions, starting from the function name/variable name at the bottom of the call graph, and proceeding upward. The corresponding function box/variable box is highlighted.
When the [Search Forward] button is clicked, the search uses the specified conditions, starting from the function name/variable name at the top of the call graph, and proceeding downward. The corresponding function box/variable box is highlighted.
If a function box/variable box has been selected on the Call Graph panel, then the search starts from the corresponding function, moving upward/downward.

The display contents are updated each time program execution is stopped. |
A function/variable whose source file does not exist in the project can be displayed in the call graph if the [Display the function/variable without definition at Call Graph panel] property in the [General] category on the [Settings] tab of the Property panel is set to [Yes]. |
 button on the panel control area.