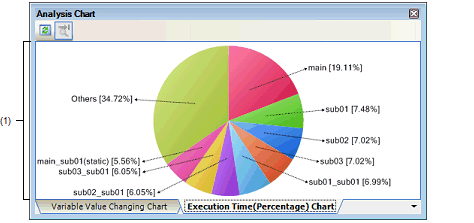
Use this tab to display the acquired function information in a pie chart of the function execution times.
See "2.13.2Chart the function execution time ratios" for details on how to display graphs on this tab.
If the debug tool used does not support the Trace function, or if the debug tool's trace function is not enabled, then this chart cannot be displayed. |
To display this chart, also see cautions of "(a)Trace function". |
[E1/E2/E2 Lite/E20[RX]] |
[E1/E2/E2 Lite/E20[RX]] |

The following items are explained here.
On the toolbar in the Main window, click the |
From the [View] menu, select [Program Analyzer] >> [Analysis Chart], and then select the [Execution Time(Percentage) Chart] tab. |
This area displays a pie chart indicating function execution time ratios.
You can change the number of functions to display by setting from the [The number of functions displaying in the Execution Time(Percentage) Chart 1-4] property in the [General] category on the [Settings] tab of the Property panel (set to [10] by default).
The targets are charted in ranking order of highest proportion of execution time taken. Functions exceeding the number specified here are displayed together under "Others".
The colors of labels and background of a chart depend on the settings of "font color" and "background color" for the [Default] item in the [General - Font and Color] category of the Option dialog box. |
You can expand or shrink the graph display from 10 to 100 % by rotating the mouse wheel forward or backward while pressing the [Ctrl] key (note that this does not apply to the font size of each label). |
Each function label is displayed in the format "Function-name[proportion of execution time (%)]".
For static files, the file name is also included inside the parentheses ( ).
The proportion of execution time is the same as the [Execution Time(Percentage)[%]] in the Function List panel. |
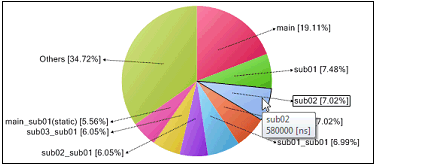
When the mouse cursor is hovered over the chart, information about that function appears in a pop-up.
The display format is as follows:
|
Indicates the name of the target function. If the target function is a member function, then this will be displayed in the format of "Class name::Function name". |
|
|
Indicates the execution time of the target function (this is the same value as the [Execution Time[unit]] in the Function List panel). The [Unit] can be changed by the [Unit of time] property in the [General] category on the [Settings] tab of the Property panel. |

 button, and then select the [Execution Time(Percentage) Chart] tab.