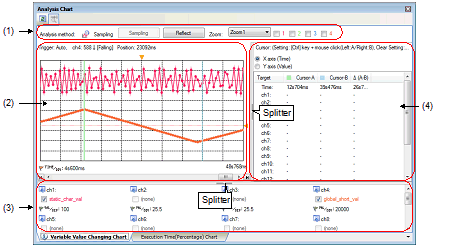
Use this tab to display the relationship between registered variable/register/address/other values and time by a graph (line chart).
Furthermore, when the selected microcontroller incorporates Smart Analog IC, by enabling Data collection mode on the debug tool, it is possible to display the collected data for Smart Analog by a graph [E1/E2/E2 Lite/E20/COM Port[RL78]].
You can zoom in on the range specified in this panel, using the Variable Value Changing Chart (zoomed in) panel.
See "2.13.1Graph transitions in values" for details on how to display graphs on this tab.
A graph is displayed based on trace data or real-time RAM monitoring results acquired by the debug tool. To display a graph, also see cautions of "(a)Trace function" or "(b)RRM function/RAM monitor (pseudo RRM) function". |
When Real-time sampling analysis is specified as the method for acquiring the graph data, also see "3.3Real-time Sampling Analysis". |
When Trace data analysis is specified as the method for acquiring the graph data, also see "3.4Trace Data Analysis". |
[E1/E2/E2 Lite/E20/COM Port[RL78]] |
See “(4)Display graphs“ for details on when graphs on this tab are updated. |
You can restore graphs currently being displayed on this tab by loading the analysis chart data file (*.mtac) which saves the data of the graphs (see “(6)Save the graph data to restore the graph“). |
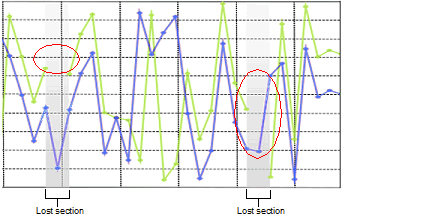
If the acquired graph data exceeds the buffer capacity (10000 plots), then the oldest graph data is overwritten by the new graph data (ring buffer system). In this case, part of the graph rendering will be blank. |
The Channel information area and Cursor information area can be shown/hidden by clicking the mark on the center of their splitter. |

The following items are explained here.
On the toolbar in the Main window, click the |
From the [View] menu, select [Program Analyzer] >> [Analysis Chart], and then select the [Variable Value Changing Chart] tab. |

Displays the analysis method currently being specified with the [Analysis method] property in the [General] category on the [Variable Value Changing] tab of the Property panel (see “(2)Specify the method for acquiring the graph data“).
Manually controls (toggles) the start/stop of the real-time sampling.
Note, however, that this button is available only when the following conditions are being satisfie:
Real-time sampling analysis is selected as the analysis method. |
[Manual] is selected in the [Start/stop real-time sampling] property in the [General] category on the [Variable Value Changing] tab of the Property panel. |
If sampling is restarted, the stored graph data will be deleted (the graph being displayed will be erased). |
Automatically registers watch-expressions currently being registered in the Watch panel (Watch1) as graphing target.
Up to 32 watch-expressions in the Watch panel (Watch1), from top to bottom are registered (see “<3>Reflecting the Watch panel (auto registration)“).
Note, however, that this button is available only when the following conditions are being satisfied:
Real-time sampling analysis or Trace data analysis is selected as the analysis method. |
[E1/E2/E2 Lite/E20/COM Port[RL78]] |
If this button is clicked, the information on the registered graphing targets will be deleted (the graph being displayed will be erased). |
When selecting the zoom range, select the number of the Variable Value Changing Chart (zoomed in) panel (Zoom1 - 4) (see “(c)Zoom“).
Note, however, that this combo box is disabled during execution of a program.
Specifies the Variable Value Changing Chart (zoomed in) panel to be displayed.
Select the check box of the corresponding number to open the Variable Value Changing Chart (zoomed in) panel (Variable Value Changing Chart (zoomed in)1 - 4) (multiple selections possible).
In the default condition, no check boxes are selected.

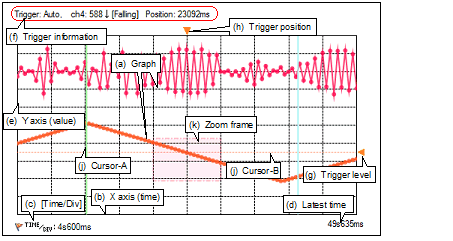
This area displays the relationship between values (Y axis (value) and X axis (time)) in the registered graphing target, in a line chart.
The function of each item displayed in this area is as follows:
The graph shows how the value of a target registered for each channel changes as the program execution proceeds. If acquisition of graph data through Real-time sampling analysis fails, however, only time information is provided with no connection lines. Such period is called a lost section and appears in the graph after the program has stopped as shown below (the background color of graphs depends on the [Background color(Lost section)] property in the [General] category on the [Variable Value Changing] tab of the Property panel).
If the debug tool has failed to acquire any single unit of data regardless of the current display range of graphs, the following message appears in the Output panel.
“RRM lost or buffer overflow has occurred, during data sampling.“

The target variable without a scope definition is outside the current scope at the time of sampling because it is a static variable inside a file or function. |
[E1/E2/E2 Lite/E20/COM Port[RL78]] |
Other than the above (see "3.4Trace Data Analysis") |
The rendering color of the graph for each channel can be changed individually via the [Color 1-32] property in the [Channel 1-32] category on the [Variable Value Changing] tab of the Property panel. |
If Real-time sampling analysis is selected, the format of the line chart can be changed via the [Chart type] property in the [General] category on the [Variable Value Changing] tab of the Property panel (see "(b)Selection of the chart type"). |
Grid lines divided in ten are displayed. The time per unit grid (Time/Div) for all channels can be specified with the [Time per grid[Time/Div] property in the [General] category on the [Variable Value Changing] tab of the Property panel (see "(c)Setting the display range"). The time display range depends on the method for acquiring the graph data (see "Table 2.14Differences Depending on Method for Acquiring Graph Data").
Displays the value specified in the [Time per grid[Time/Div] property in the [General] category on the [Variable Value Changing] tab of the Property panel.
Note that only while program execution is stopped, double-clicking on this label automatically adjusts the [Time per grid[Time/Div]] property to an optimum value so that the specified number of value transition points of the graph fit inside the rendering area (between the left and right ends) (see "(c)Setting the display range").
Displays the latest time corresponding to the graph data.
Displays the values of the registered graphing target.
Grid lines divided in ten are displayed. The value per unit grid (Val/Div) for each channel can be specified with the [Value per grid[Val/Div] 1 - 32] property in the [Channel 1 - 32] category on the [Variable Value Changing] tab of the Property panel.
While the program is stopped, the axis line representing the origin (Value = 0) will be displayed as a dotted line in the rendering color of each channel.
The display range of Y axis (value) depends on the [Value per grid[Val/Div] 1-32] property and [Offset 1-32] property setting, but if the obtained value is greater than the maximum or less than the minimum, nothing is displayed on the graph for that segment. |
The offset value for each channel can be specified in unit grids of Y axis with the [Offset 1-32] property in the [Channel 1-32] category on the [Variable Value Changing] tab of the Property panel. |
Displays the contents currently being set in the [Trigger] category on the [Variable Value Changing] tab of the Property panel if the trigger function is used (see “(3)Use the trigger function“).
“-“ will be displayed in this area if the trigger function is not used.
Indicates the trigger level when the trigger function is used (see “(3)Use the trigger function“).
The value of the trigger level can be changed by dragging this trigger mark with the mouse.
Note, however, that this operation is disabled during execution of a program.
Indicates the trigger position when the trigger function is used (see “(3)Use the trigger function“).
The value of the trigger position can be changed by dragging this trigger mark with the mouse.
Note, however, that this operation is disabled during execution of a program.
When the mouse cursor is hovered over a transition location on the graph, the information about that location appears in a pop-up.
The display format is as follows:

The [Location] information is only displayed both when the graph data is acquired via Trace data analysis and when the transition location information exists in the graph data (if the information does not exist, "-" will be displayed). In this case, furthermore, you can display the applicable location in the Editor panel by double-clicking the transition point (except for a graph that was restored by loading the analysis chart data file (*.mtac)). |
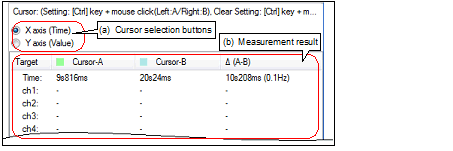
These two cursors (Cursor-A and Cursor-B) are used to check the time and value on the X axis (time) or Y axis (value). Under Cursor selection buttons, select the [X axis (Time)] button to perform a cursor measurement for the X axis (time), and the [Y axis (Value)] button to perform it for the Y axis (value).
The measurement results are listed in the Cursor information area.
Use the following operations to show or hide the cursors (the cursors are hidden by default).
When the [X axis (Time)] button is selected for the target axis, you cannot set the cursors in the area on the left of "0s", regardless of whether the graph data exists. |
The color of each cursor can be changed via the [Cursor-A color]/[Cursor-B color] property in the [General] category on the [Variable Value Changing] tab of the Property panel. |
Indicates the zoom range displayed in the Variable Value Changing Chart (zoomed in) panel (see "(c)Zoom").
You can specify different zoom ranges for four different Variable Value Changing Chart (zoomed in) panels by selecting the panel numbers in the [Zoom] combo box.
The color of each zoom frame can be changed via the [Zoom-1 - 4 color] property in the [General] category on the [Variable Value Changing] tab of the Property panel. |
The display range of this area can be changed by moving the splitter with the mouse.
In addition, this area can be shown/hidden by clicking the mark on the center of the splitter.
For how to integrate the settings for channels into a pattern and switch the pattern from among multiple patterns, refer to Remarks 2. of [Channel 1 - 32] in the [Variable Value Changing] tab of the Property panel.

Displays the channel number (ch1 to ch32).
[E1/E2/E2 Lite/E20/COM Port[RL78]] |
Displays the name of a variable (including register name/address expression) currently being registered in the channel as a graphing target, in a check box format ("none" will be displayed if no graphing target is registered).
The character color of the variable name is the same as the rendering color of the graph.
Select the check box to display the graph corresponding to the variable (multiple selections possible).
In the default condition, all check boxes where the graphing target is being registered are selected.
[E1/E2/E2 Lite/E20/COM Port[RL78]] |
See “(1)Register graphing targets“ for details on how to register the graphing target. |
The color of the graph for each channel can be changed individually via the [Color 1-32] property in the [Channel 1-32] category on the [Variable Value Changing] tab of the Property panel. |
Displays “the value per unit grid“ currently being specified with the [Value per grid[Val/Div] 1 - 32] property in the [Channel 1-32] category on the [Variable Value Changing] tab of the Property panel.
When the program is not running, double-clicking this label automatically adjusts the values of the [Value per grid[Val/Div] 1 - 32] and [Offset 1-32] properties so that the graph for the selected channel will be shown in the entire rendering area (see "(c)Setting the display range").
The display range of this area can be changed by moving the splitter with the mouse.
In addition, this area can be shown/hidden by clicking the mark on the center of the splitter.

Select the target axis to perform a Cursor measurement.
Note, however, that this button is disabled during execution of a program.
This area displays the following measurement result from the cursor-A and cursor-B positions.
Note, however, that the information below disappears during execution of a program.
|
|||||
|
 button, and then select the [Variable Value Changing Chart] tab.
  from
from  .
.