This trace operation can be configured in the [Trace] category on the [Debug Tool Settings] tab in the Property panel.

Select the trace target from the following drop-down list.
The choices of this property vary depending on the mode selected by the [Debug mode] property in the [Multi-core] category on the [Debug Tool Settings] tab of the Property panel.
|
Collects the trace data regarding the currently selected PE (default). After collecting the trace data, the contents of the Trace panel is not changed even if you switch PE. |
|
|
Collects the trace data for all PEs. After collecting the trace data, if you switch PE, the contents of the Trace panel will be updated to the corresponding trace data. |
This property appears only when the selected microcontroller is a multi-core.
This property can be changed only while all cores are stopped.
This property can be changed only while all cores are stopped. |
Select the type of trace data to be collected from the following properties.
Select which item should be given priority when using the trace function from the following drop-down list.
|
Traces giving priority to the real-time performance (default). |
|
|
Traces after stopping the execution pipeline of the CPU temporarily so that no data is missed. |
Select whether to clear (initialize) the trace memory before tracing starts.
Select [Yes] to clear the memory (default).
You can forcibly clear the trace memory when clicking the |
Select the operation after the trace memory is full with the collected trace data from the following drop-down list.
|
Continues overwriting the older trace data after the trace memory is full (default). When the [Clear trace memory before running] property is set to [Yes], at the time of a resumption, trace data is collected after clearing the trace memory. |
|
|
When the trace memory is full, CS+ stops writing trace data (the program does not stop execution). |
|
|
When the trace memory is full, CS+ stops writing trace data and the program stops execution. |
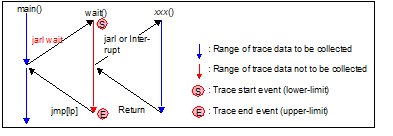
Select the range of trace data to be collected from the following drop-down list.
Note, however, that this property can be changed only when connected to the debug tool.
If this property is changed, then all trace start and trace end events currently being set will become invalid. |
When [Traces out of range] is selected, the range of trace data to be collected will be determined by a lower-limit address and an upper-limit address that are specified with a trace start event and a trace end event. |

Specify from the drop-down list the size of trace memory (i.e. the number of trace frames) in this property.
The trace frame is a unit of trace data. One trace frame is used for each operation in fetch/write/read (default: [8K]).
Select whether to enable complement display when displaying the collected trace data in the Trace panel.
By enabling complement display, instructions between branch instructions that cannot be traced by hardware can be displayed.
Select [Yes] to enable complement display (default).
This setting will be applied from the next acquisition of trace data.
 button in the toolbar in the