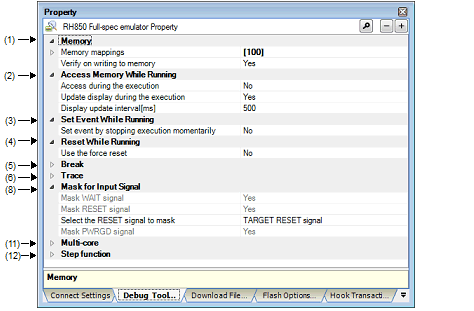
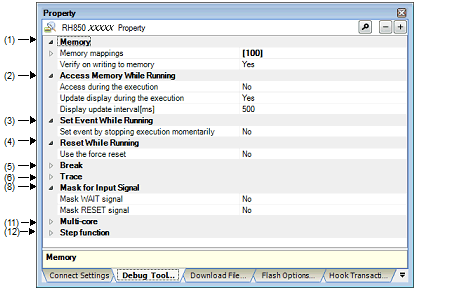
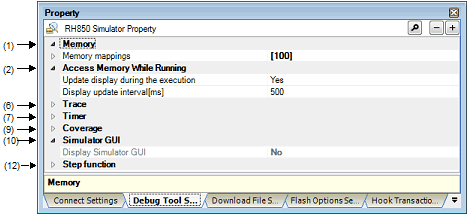
This tab is used to display the detailed information categorized by the following and the configuration can be changed.
(2) [Access Memory While Running]
(3) [Set Event While Running] [Full-spec emulator][E1][E20]
(4) [Reset While Running] [Full-spec emulator][E1][E20]
(5) [Break] [Full-spec emulator][E1][E20]
(8) [Mask for Input Signal] [Full-spec emulator][E1][E20]
(10) [Simulator GUI] [Simulator]
(11) [Multi core] [Full-spec emulator][E1][E20]


[Description of each category]
The detailed information on memories is displayed and its configuration can be changed.
|
The state of memory mapping is displayed for each type of memory areaNote 1. |
|||
|
[Sum total by microcontroller's inherent type of memory mapped area] |
|||
|
Specify with the Memory Mapping dialog box. The Memory Mapping dialog box is opened by clicking the [...] button that appears at right edge of this field when you select this property (you cannot change the memory mapping on this panel). |
|||
|
Displays the memory mapping status for each type of memory area. The following detailed information is displayed by clicking the "+" mark of each memory type. |
|||
|
Select whether to perform a verify check when the memory value is initialized. |
|||
This appears only when the memory type is External Memory. |
The detailed information on memory accesses while executing a program (real-time display update function: see "2.10.1.4 Display/modify the memory contents during program execution") is displayed and its configuration can be changed.
|
Select whether to allow access to the internal RAM area during execution of a program. |
|||
|
Accesses to the internal RAM area during execution of a program. |
|||
|
Does not access to the internal RAM area during execution of a program. |
|||
|
Select whether to update the display in the Memory panel/Watch panel during a program execution. |
|||
|
Specify the interval in 100ms unit to update the contents in the Memory panel/Watch panel display while executing a program. This property appears only when the [Update display during the execution] property is set to [Yes]. |
|||
|
Integer number between 100 and 65500 (rounding up the fractions less than 100 ms) |
|||
The detailed information on the function of the event setting during program execution is displayed and its configuration can be changed.
|
Select whether to forcibly pause the execution for events that cannot be set while executing the program or operating the tracer/timer. For details on the event types that are affected by this property, see "2.17.6.2 Event types that can be set and deleted during execution". |
||||
|
Sets these events by stopping the program execution or the tracer/timer operation momentarily. |
||||
|
Does not allow to set these events during program execution or the tracer/timer operation. |
||||
The detailed information on the reset operation during program execution is displayed and its configuration can be changed.
The detailed information on break functions is displayed and its configuration can be changed.
|
Select whether to use the Software break function [Full-spec emulator][E1][E20]Note. |
||||
|
Select from the drop-down list. Note that changes can be made only when program execution is halted. |
||||
|
Select the type of the breakpoint to use with priority when setting it at the source line or the execution address with a one click operation of the mouse in the Editor panel/Disassemble panel. |
||||
|
Select whether to terminate the peripheral emulation while stopping the program execution (Peripheral Break). |
||||
If this property is set to [No] after you have used the software break function, all software break events and Printf events that have been set will be disabled. Selecting [Yes] in this state does not automatically restore the events, so you will need to manually enable them. |
The detailed information on trace functions is displayed and its configuration can be changed (see "2.12.1 Configure the trace operation").
[Full-spec emulator][E1][E20] |
[E1][E20] |
|
Select whether to collect PC values for source/destination instructions of branching during program execution as trace data. |
||||
|
Select whether to collect data information on access-related events that occurred during program execution as trace data. |
||||
|
Select whether to collect PC values for instructions of access-related events that occurred during program execution as trace data. When PC values are collected, the executed instructions are displayed in the Trace panel. This property appears only when the [Trace the data access] property is set to [Yes]. |
||||
|
Select whether to collect data information on access-related events for accesses to local variables that occurred during program execution as trace data. This property appears only when the [Trace the data access] property is set to [Yes]. |
||||
|
Select whether to collect PC values for the source and destination instructions of branching during program execution and the PC values and information on the data for instructions leading to access-related events that occur during program execution as trace data. |
||||
|
Select whether to collect information on trace output instructions to be embedded that were generated during program execution as trace data. |
||||
|
Select whether to collect information on DBCP that were generated during program execution as trace data. This property appears only when the [Trace the software trace] property is set to [Yes]. |
||||
|
Select whether to collect information on DBTAG that were generated during program execution as trace data. This property appears only when the [Trace the software trace] property is set to [Yes]. |
||||
|
Select whether to collect information on DBTAG that were generated during program execution, along with the values of addresses where the DBTAG instructions were executed. This property appears only when the [Trace the software trace] property is set to [Yes]. |
||||
|
Select whether to collect information on DBPUSH that were generated during program execution as trace data. This property appears only when the [Trace the software trace] property is set to [Yes]. |
||||
|
Select whether to collect information on DBPUSH that were generated during program execution, along with the values of addresses where the DBTAG instructions were executed. This property appears only when the [Trace the software trace] property is set to [Yes]. |
||||
|
Select which item should be given priority when collecting the trace dataNote 1. |
||||
|
Traces after stopping the execution pipeline of the CPU temporarily so that no data is missed. |
||||
|
Select from the drop-down list. Note that changes can be made only when program execution is halted. |
||||
|
Select the operation after the trace memory is full with the collected trace dataNote 1. |
||||
|
Continues overwriting trace data even after trace memory is used up. |
||||
|
Stops overwriting trace data when trace memory is used up (the program execution will not be stopped). |
||||
|
Stops running the program and overwriting trace data when trace memory is used up. |
||||
|
Select whether to display the accumulated tracing time in the Trace panel. |
||||
|
Select the frequency division ratio of the counter to be used for time tag display (the [Time] item in the Trace panel). Changing the frequency division ratio here changes the number of clocks necessary to count up a counter value which is displayed in the time tag. |
||||
|
1/1, 1/2, 1/4, 1/8, 1/16, 1/32, 1/64, 1/128, 1/256, 1/512, 1/1K, 1/4K, 1/8K, 1/16K, 1/64K, 1/256K, 1/1M |
||||
|
Collects the execution history as trace data within the section specified with a trace start event and a trace end event. |
||||
|
Collects the execution history as trace data outside the range specified with a trace start event and a trace end event. |
||||
|
Select the memory size for storing the trace data by the trace frame numbersNote 1, 4. |
||||
|
8K, 32K, 64K, 128K, 256K, 512K 4K, 8K, 12K, 16K, 20K, 24K, 28K, 32K, 36K, 40K, 44K, 48K, 52K, 56K, 60K, 64K, 128K, 192K, 256K, 320K, 384K, 448K, 512K, 576K, 640K, 704K, 768K, 832K, 896K, 960K, 1M, 2M, 3M |
||||
|
Select whether to enable complement display when displaying the collected trace data. By enabling complement display, instructions between branch instructions that cannot be traced by hardware can be displayed. This setting will be applied from the next acquisition of trace data. |
||||
|
Collects the trace data regarding the currently selected PE (default). |
||||
[Full-spec emulator][E1][E20] |
This property is automatically set to [Yes] when selecting [Start Tracing]/[Stop Tracing] from the context menu in the Editor panel/Disassemble panel. |
[E1][E20] |
The detailed information on timer functions is displayed and its configuration can be changed.
The detailed information on the masking input signal is displayed and its configuration can be changed.
|
Select whether to mask WAIT signal to prevent the signal input to emulators. |
||||
|
Select whether to mask RESET signal to prevent the signal input to emulators. |
||||
|
Select a RESET signal to be masked. This property appears only when the [Mask RESET signal] property is set to [Yes]. |
||||
|
Select whether to mask PWRGD signal to prevent the signal input to emulators. |
||||
[Full-spec emulator] |
[Full-spec emulator] |
If this property cannot be set as [Yes] in the POD, it is automatically fixed to [No] after connection to the debug tool (changing from this setting is not allowed). |
The detailed information on coverage functions is displayed and its configuration can be changed.
|
Select whether to load/save the coverage measurement result when connecting to or disconnecting from the debug tool. This property appears only when the [Use coverage function] property is set to [Yes]. |
||||
|
Specify the area that performs coverage measurement. Specify the start address of any 1 Mbyte space other than the internal ROM area. This property appears only when the [Use coverage function] property is set to [Yes]. |
||||
|
Address without the address range of the internal ROM area (symbols cannot be used). |
||||
The detailed information on the Simulator GUI function is displayed and its configuration can be changed.
If a microcontroller whose Simulator does not support peripheral function simulations is selected (i.e. the selected microcontroller supports only a instruction simulator), all properties in this category become invalid. |
|
Select whether to display the Simulator GUI window to use the Simulator GUI function. |
||||
|
Select from the drop-down list. Note that changes can be made only when program execution is halted. |
||||
|
Select whether to display the Simulator GUI window in the forefront when program execution starts. This property appears only when the [Display Simulator GUI] property is set to [Yes]. |
||||
The detailed information on the control method of a multi-core is displayed and its configuration can be changed.
The detailed information on the control method of step execution is displayed and its configuration can be changed.
|
This property appears only when the [Skip target section] property is set to [Yes]. |
||||
|
Specify with the Specified Section dialog box. The Specified Section dialog box is opened by clicking the [...] button that appears at right edge of this field when you select this property (The sections to be skipped cannot be specified from this panel.). |
||||