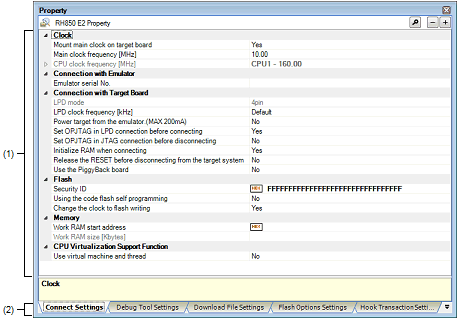
This panel is used to display and set the debug tool operation environment that is selected in the Project Tree panel.

This section describes the following.
On the Project Tree panel, select the [Microcontroller type Debug tool name (Debug Tool)] node to use, and then select [Property] from the [View] menu or the context menu. |
On the Project Tree panel, double-click the [Microcontroller type Debug tool name (Debug Tool)] node to use. |
If this panel has been opened, the detailed information on the debug tool is displayed by selecting the [Microcontroller type Debug tool name (Debug Tool)] node on the Project Tree panel. |
In this area, the detailed information on the debug tool that is selected in Project Tree panel is displayed by category in the list. Also, you can directly change its settings.
The  mark is indicates all the items in the category are expanded. The
  mark indicates all the items are collapsed. You can expand/collapse the items by clicking these marks or double-clicking the category name.
Note that only the hexadecimal number is allowed in the text box if the  mark is displayed in the property configuration area.
For details on the information/how to setup in the category and property items contained in it, see the section explaining the corresponding tab.
Categories for the display of the detailed information are changed when each tab is selected.
In this panel, following tabs are contained (see the section explaining each tab for details on the display/setting on the tab).
[[Edit] menu (Property panel-dedicated items)]
[While not editing the property value]
|
Restores the selected setting of the property item to default value. |
|
|
Restores all the selected settings of the property items on the tab to default value. |
[While editing the property value]