Everything

Realtime OS Task Analyzer panel

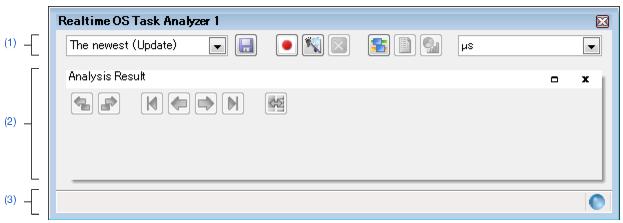
This panel displays the analysis information such as the execution transition state of the processing program, the state of real-time OS resource usage, and CPU usage status.
Figure A-1. Realtime OS Task Analyzer Panel
The following items are explained here.
[How to open]
- From the [View] menu, select [Realtime OS] >> [Task Analyzer 1 - 2].
[Description of each area]
(1) Toolbar
This area consists of the following drop-down lists and buttons.
When the execution of the load module is stopped, specifies whether or not to update the analysis information displayed in the Child-panel display area, or selects the task analyzer trace data which holds the analysis information to be displayed in the Child-panel display area.
The newest (Update)
Updates the analysis information in the Child-panel display area when the execution of the load module stops or when this item is selected.
Not update
Does not update the analysis information in the Child-panel display area when the execution of the load module stops.
Opens trace data...
Reads the analysis information saved as task analyzer trace data to open the Open dialog box which displays the information in the Child-panel display area.
Task analyzer trace data name
Displays the analysis information which has been held in the given file on the Child-panel display area.
Opens the Save As dialog box to save the analysis information displayed in the Child-panel display area as task analyzer trace data.
/
Selects whether or not to acquire trace data when the execution of the load module is started.
Indicates that a trace start event has not been set. When the button is in this condition, trace data is not acquired when the execution of the load module is started.
Indicates that a trace start event has been set. When the button is in this condition, trace data is acquired when the execution of the load module is started.
Clears the analysis information displayed in the Child-panel display area. When this button is pressed, the content of the trace buffer is also cleared.
Always invalid for this version.
Selects units of time when the time-related analysis information (Total Execution Time, Average Execution Time, etc.) is displayed in the Child-panel display area.
s
by the second
ms
by the millisecond
us
by the microsecond

(2) Child-panel display area
This area consists of the following child-panel.
Remark For details on this area, see section "Analysis Result panel".
(3) Status bar
This area consists of the following bars and marks.
Indicates processing progress for this panel.
The item in progress is displayed on the left side of the status bar.
/
Indicates whether or not the task analyzer tool is or is not in a condition that allows to analyze the execution transition state of the processing program, the state of real-time OS resources usage, the CPU usage status, etc.
Indicates that the task analyzer tool is in a condition that allows various analyses to be performed.
Indicates that the task analyzer tool is in a condition that does not allow various analyses to be performed due to the tool tip that is displayed when the mouse cursor is placed on this mark.