Everything
2.20 Using the Debug Console

This section describes how to use the debug console for standard I/O.

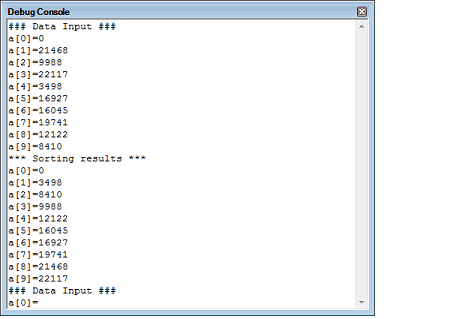
To perform some operation using a program's internal standard library functions, such as the scanf function for reading the data entered from the keyboard or the printf function for outputting data, use the Debug Console panel shown below.

Figure 2.172

Debug Console Panel


For details about each functionality of the debug console, see the section in which the Debug Console panel is described.


Before standard I/O based on the Debug Console panel can be used in a C/C++ program, there must be a low-level interface routine in the program.


CS+ comes with sample project "RX610_Tutorial_DebugConsole" for the E1/E20, which has the following files for debug console functions.


-

Low-level interface routine files (C language part) (lowsrc.c and lowsrc.h)

-

Low-level interface routines: open, close, read, write, and lseek

Called by standard I/O.


-

Initialize I/O libraries: _ INIT_IOLIB

-

Close all open functions: _CLOSEALL

Each called by the internal initialization routine "PowerON_Reset_PC" of the initialization routine file resetprg.c.


-

Low-level interface routine file (assembly language part) (lowlvl.src)

-

Function to output 1 character: _charput

-

Function to input 1 character: _charget

Called by low-level interface routines "write" and "read," respectively.


-

Source file including the main function (DebugConsole_Sample.c)

-

Calls the standard library functions scanf and printf in the main function.


Caution 1.

[E1] [E20]
To use the debug console, do not switch the system clock in the charput and charget functions of the program. Switching of the system clock may adversely affect the communication between the emulator and microcontroller, hampering normal transmission or reception of data.
When the debug console is used, real-time performance of the user program is affected due to transmission or reception of data.

Caution 2.

[E2]
The debug console cannot be used for measuring current consumption.

Remark 1.

For details about the low-level interface routines, see "CC-RX Compiler User's Manual".

Remark 2.

[Simulator]
As a method for executing standard I/O, an emulator-like method and a simulator-inherent method are supported. In a simulator-inherent method, file I/O, not just standard I/O, can also be used.
Each supported method changes from one to another as you specify in the [Select stream I/O mode] property in the [Stream I/O] [Simulator] category on the Property panel's [Debug Tool Settings] tab.
For details about the simulator's I/O functions, see "B. I/O FUNCTIONS."


To use sample projects with debug console functions, follow the procedure described below.

(1)

Loading a sample project

From [Open Sample Project] on the Start panel of CS+, load sample project "RX610_Tutorial_DebugConsole" for the E1/E20.

Remark

For details about the "Start panel," see the separate edition, "CS+ Project Operation."

(2)

Editing the low-level interface routine file (assembly language part) [Simulator]

To execute stream I/O in simulator mode, you need to edit the content of a file (lowlvl.src) for low-level interface routines (assembly language part) to make it usable for a simulator.

Replace the contents of "lowlvl.src" with the following sample code for the simulator.

         .GLB    _charput
         .GLB    _charget
SIM_IO   .EQU 0h
         .SECTION   P,CODE
;-----------------------------------------------------------------------
;  _charput:
;-----------------------------------------------------------------------
_charput:
         MOV.L      #IO_BUF,R2
         MOV.B      R1,[R2]
         MOV.L      #1220000h,R1
         MOV.L      #PARM,R3
         MOV.L      R2,[R3]
         MOV.L      R3,R2
         MOV.L      #SIM_IO,R3
         JSR        R3
         RTS
;-----------------------------------------------------------------------
;  _charget:
;-----------------------------------------------------------------------
_charget:
        MOV.L       #1210000h,R1
        MOV.L       #IO_BUF,R2
        MOV.L       #PARM,R3
        MOV.L       R2,[R3]
        MOV.L       R3,R2
        MOV.L       #SIM_IO,R3
        JSR         R3
        MOV.L       #IO_BUF,R2
        MOVU.B      [R2],R1
        RTS
;-----------------------------------------------------------------------
;  I/O Buffer
;-----------------------------------------------------------------------
         .SECTION  B,DATA,ALIGN=4
PARM:    .BLKL     1
         .SECTION  B_1,DATA
IO_BUF:  .BLKB     1
         .END

(3)

Selecting the debug tool to be used

To select or switch the debug tool, use the context menu shown by right clicking on the [Microcontroller type Debug tool name (Debug Tool)] node on the Project Tree panel.

Remark

For the details of debug tool selection, see "2.3.1 Select the debug tool to use".

(4)

Changing settings in the Property panel [Simulator]

When the simulator is to be used, the following settings must be made in the [Stream I/O] [Simulator] category on the [Debug Tool Settings] tab of the Property panel.

Figure 2.173

[Stream I/O] Category

(a)

[Select stream I/O mode]

To use files for the same low-level interface routines (assembly language part) as the emulator, specify [Emulator mode]. (By default, [Simulator mode] is specified.)

(b)

[Use stream I/O function]

This property is displayed only when [Simulator mode] is specified in the [Select stream I/O mode] property.

If you intend to perform standard I/O or file I/O, select [Yes] (default selection: [No]).

(c)

[Stream I/O address]

This property is displayed only when [Simulator mode] is specified in the [Select stream I/O mode] property.

If you have replaced the low-level interface routines (assembly-language part) with the sample code for the simulator, enter "0" (default).

(5)

Executing a download

Choose [Build & Download] from the [Debug] menu on the Main window. Then, when connected with the debug tool, perform a build and a download (see "2.5.1 Execute downloading").

(6)

Opening the Debug Console panel

Open the Debug Console panel.

(7)

Executing the program

Execute the program (see "2.9 Execute Programs").

(8)

Performing data I/O on Debug Console panel

By executing the program, perform data I/O on the Debug Console panel.

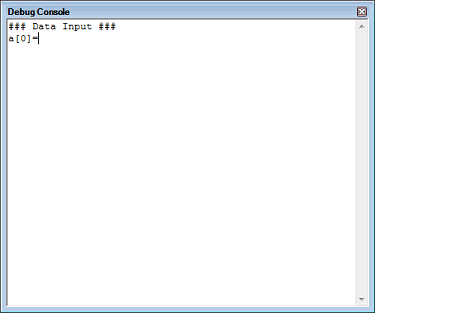
This program reads 10 entries of data that have been entered from the keyboard onto the panel by the scanf function and then sorts the input data in ascending order. It then outputs data onto the panel using the printf function.
 

-

The element names of the array "a" in which data is stored are output onto the panel by the printf function in the main function.

-

When data is entered from the keyboard onto the panel, the data is read in by the scanf function in the main function.


-

The sorted data is output onto the panel by the printf function in the main function.

Remark

If you disable the local echo back function in [Echo Back] selected from the Debug Console panel's context menu, the character strings you have entered will not be displayed (local echo back will not be performed.)