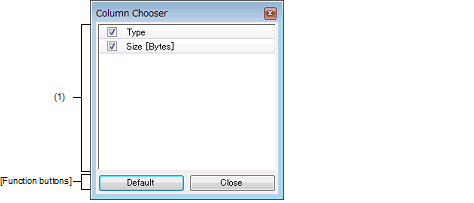
This dialog box is used to sort, show/hide the columns displayed on the Memory Mapping Profiler panel.
If the display in the panel has been customized, all of those customizations can be returned to the default state in this dialog box.

The following items are explained here.
On the Memory Mapping Profiler panel, click the |
This area displays a list of all columns that can be displayed on the Memory Mapping Profiler panel.
The display order of the columns in this list, and the state of check boxes, are the same as the current sort order and visible/hidden status in the panel.
This area has the following functions.
Rearrange the columns on the Memory Mapping Profiler panel |
The columns displayed on the panel can be rearranged with the following method.
Drag the column displayed in this dialog box and drop it in the [Details of the selected memory mapping] area on the panel. |
Specify display or non-display for columns on the Memory Mapping Profiler panel |
The columns to be displayed on the panel can be set with either of the following methods.
Drag a column displayed in this dialog box and drop it in the [Details of the selected memory mapping] area on the panel. |
The columns not to be displayed on the panel can be set with the following method.
|
Resets the display order and visible/hidden settings for columns on the Memory Mapping Profiler panel to their default values. |
|
 button.