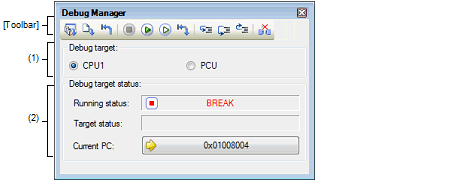
When the selected microcontroller is the multi-core product, this panel is used to select a core (PE: Processer Element) to be debugged and display the core status (see "2.10 Select a Core (PE)").
This panel appears only when connected to the debug tool.

This section describes the following.
Select a core (PE) to be debugged with a option button.
This area becomes invalid during execution of a program.
You can also select a core to be debugged on the statusbar in the Main window. |
This area displays the status of the core currently being selected.
You can also confirm the information displayed in this area on the statusbar in the Main window. |
Displays the current state of the program with the following icons and character strings.
Displays the current core statuses of the debug tool. When there is the possibility that the core is in two or more statuses, the corresponding display contents are displayed separated by "&".
|
This is the state of the core other than the main core when the main core is in the Cyclic Run or Cyclic Stop mode. |
||
Displays the current PC position with a hexadecimal value. When this button is clicked, the caret moves to the current PC position on the Editor panel.
The function of this toolbar is the same as that of the Debug toolbar on the Main window. For details on the function of each button, see "(2) Debug toolbar".
 RUN
RUN BREAK
BREAK STEP
STEP