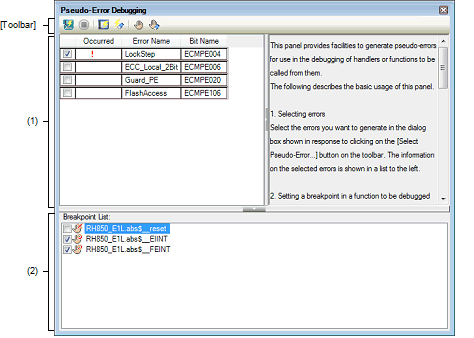
This panel is central to the functionality of the solution for pseudo-error debugging.
See "2.23 Pseudo-error Debugging [Full-spec emulator][E1][E20]" for details on the solution for pseudo-error debugging.

This section describes the following.
This area lists pseudo-errors which are targets in pseudo-error debugging.
The full name of a pseudo-error is displayed by hovering the mouse cursor over the node of each pseudo-error.
Each item is explained as follows:
When a check box is selected, this pseudo-error is generated after pseudo-error debugging starts.
This column shows whether this pseudo-error has been generated when the debugger is stopped.
"!" is displayed if the pseudo-error has been generated and nothing is displayed if it has not been generated.
For RH850/G4MH devices, the number of occurrences of a pseudo-error that can be counted is up to three. If the corresponding pseudo-error occurs more times than this, "!" will be displayed as the counted number of times the pseudo-error occurred. |
The abbreviated name of this pseudo-error is displayed.
The bit name of IOR that triggers the generation of this pseudo-error is displayed.
A list of breakpoints that are to be used for pseudo-error debugging is displayed.
Only the breakpoints whose check box is selected will be valid for pseudo-error debugging.
Either of the following icons is displayed at the beginning of each breakpoint.
|
Starts pseudo-error debugging based on the settings made in this panel. |
|
|
Has the same functionality as the same button on the Debug toolbar in the Main window. |
|
|
Opens the Select Pseudo-Error dialog box [Full-spec emulator][E1][E20] used to select ECM pseudo-errors that are targets of pseudo-error debugging. |
|
|
Opens the Breakpoint Setting dialog box [Full-spec emulator][E1][E20] to add a breakpoint. |
|


