2.4.2 Filtering of analysis information
On the Analysis Result panel, using the  icon located in the column header in the Analysis information table area, the analysis information displayed in the analysis information table area can be filtered.
To filter analysis information, use the Filtering menu which is displayed by clicking on the  icon located in the column header in the Analysis information table area.
Opens the Filter Settings dialog box that sets a filter condition on analysis information which is displayed as a CPU usage status.
|
|
In the Filter Settings dialog box which is opened by selecting [(Custom)], the user can set detailed filter conditions.
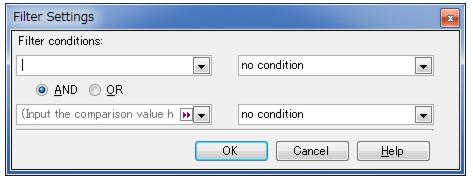
The filtering of analysis information can be performed by pressing the [OK] button after setting a filter condition in the 1st filter condition setting area in the Filter Settings dialog box.
Remarks 1. When performing filtering using one filter condition, set the combo box in the 2nd filter condition setting area (left side) to "blanks", and the combo box (right side) to "no condition".
2. When filtering is to be performed using one filter condition, any settings in the Logic condition setting area are ignored.
The filtering of analysis information can be performed by pressing the [OK] button after setting logic condition in the Logic condition setting area, and setting filter conditions in the 1st filter condition setting area and the 2nd filter condition setting area in the Filter Settings dialog box.