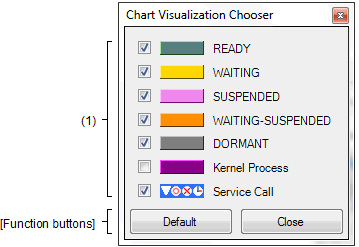
This dialog box specifies the type of state line to be displayed as an execution transition of the processing program, and whether an event mark is or is not to be displayed as a real-time OS resource usage status, in the Analysis information diagram area on the Analysis Result panel.

The following items are explained here.
Press the |
Selects whether or not to display the applicable state line or event mark in the Analysis information diagram area on the Analysis Result panel.
|
Displays the applicable state line or event mark in the Analysis information diagram area on the Analysis Result panel. |
|
|
Hides the applicable state line or event mark from the Analysis information diagram area on the Analysis Result panel. |
|
Resets the type of state line to be displayed and whether an event mark is or is not to be displayed in the Analysis information diagram area on the Analysis Result panel to its default condition. |
|
 button located on the