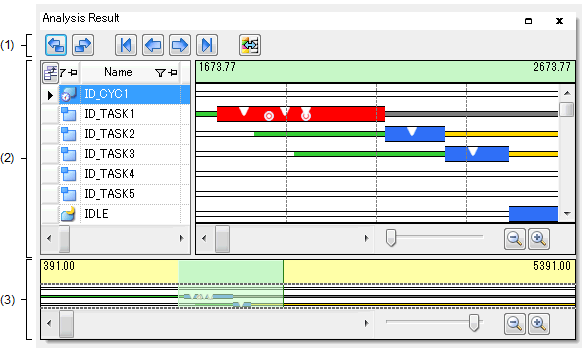
This panel is a Child-panel display area of the Realtime OS Task Analyzer panel to display the analysis information such as execution transition state of the processing program, the state of real-time OS resource usage, and the CPU usage status.
The following items are explained here.
Press the |
 button located on the
 This area consists of the following buttons.
|
In the Analysis information diagram area, changes the red-highlighted processing interval from "the processing interval now being highlighted in red" to "the processing interval which was executed prior to the highlighted processing interval". |
|
|
In the Analysis information diagram area, changes the red-highlighted processing interval from "the interval now being highlighted in red" to "the interval which was executed immediately after the highlighted processing interval". |
|
|
In the Analysis information diagram area, changes the red-highlighted processing interval from "the interval now being highlighted in red" to "the interval at which the given processing program was executed first". Note that the "first executed" processing interval is the interval at which the given processing program was executed first during trace data acquisition. |
|
|
In the Analysis information diagram area, changes the red-highlighted processing interval from "the interval now being highlighted in red" to "the interval just before which the given processing program was executed". |
|
|
In the Analysis information diagram area, changes the red-highlighted processing interval from "the interval now being highlighted in red" to "the interval immediately after which the given processing program was executed". |
|
|
In the Analysis information diagram area, changes the red-highlighted processing interval from "the interval now being highlighted in red" to "the interval at which the given processing program was executed last". Note that the "last executed processing interval" is the interval at which the processing program was executed last during trace data acquisition. |
|
|
Opens the Chart Visualization Chooser dialog box to specify the type of state line to be displayed as an execution transition state of the processing program, and whether an event mark is or is not displayed as real-time OS resources usage status, in the Analysis information diagram area. |


Displays analysis information including the execution transition state of the processing program, the state of real-time OS resource usage, and the CPU usage status, among the acquired trace data.
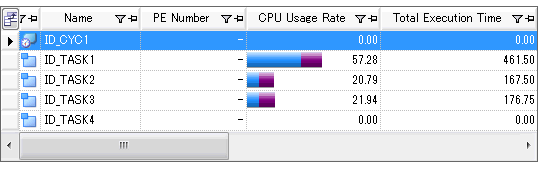
Displays the analysis information about the CPU usage status in table form.
The following table shows the elements which make up this area.
The analysis information displayed in this area is the CPU usage status during trace data acquisition or during the Analysis information extraction interval during which data is extracted by mouse cursor drag & drop in the Execution transition display area in the Analysis information diagram area.
|
Opens the Column Chooser dialog box to specify the types of items to be displayed as the CPU usage status in the Analysis information table area. |
|||
|
Displays whether a filter condition is or is not set for the target column. |
|||
|
Indicates that a filter condition is not set for the column. Clicking on this icon displays the following filtering menu. |
|||
|
Opens the Filter Settings dialog box to set a filter condition on analysis information which is displayed as CPU usage status. |
|||
|
Indicates a column for which a filter condition has been set. |
|||
|
Indicates whether the target column is or is not the scroll target during horizontal scrolling using the scroll bar. |
|||
|
Displays the type of the objects (processing program or real-time OS resource). Note that the processing programs displayed in this column are limited to the ones which were executed during trace data acquisition, and the real-time OS resource displayed in the column is limited to the one whose task was queued in the task wait queue of the object during trace data acquisition. |
|||
|
Displays the execution ratio (total ratio or user/kernel ratio) for the processing program. The [Context menu] menu is used to switch between "total ratio" and "user/kernel ratio". |
|||
|
Displays the total execution time of the processing program. |
|||
|
Displays the average continuous execution time of the processing program. |
|||
|
Displays the maximum continuous execution time of the processing program. |
|||
|
Displays the minimum continuous execution time of the processing program. |
|||
|
Displays the execution count (number of times of execution from the start) of the processing program. |
|||

 /
/ 


 /
/ 


 /
/ 


Displays analysis information about the execution transition state of the processing program and real-time OS resource usage status in diagram form.
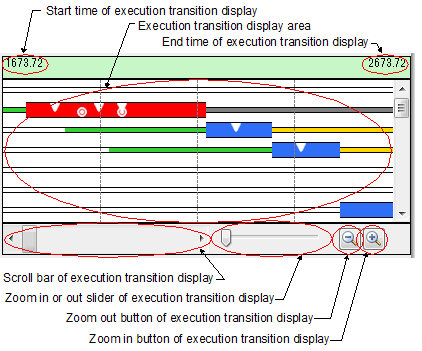
The elements which make up this area are as follows.
Displays start time of Execution transition display area.
Displays end time of Execution transition display area.
Displays the execution transition state of the processing program and real-time OS resource usage status for the displaying trace data specified by Zoom in or out slider of execution transition display or Zoom in button of execution transition display and Zoom out button of execution transition display.
Period which to display in the Execution transition display area can be changed from 1us to 1ms.
In this area, execution transition state of the processing program is indicated as follows:
|
Indicates that a task is in transition to the WAITING state, or a task has been queued in the wait queue of the real-time OS resource. |
|
|
Indicates that a task is in transition to the SUSPENDED state. |
|
|
Indicates that a task is in transition to the WAITING-SUSPENDED state. |
|
|
Indicates that a task is in transition to the DORMANT state. |
|
|
Indicates that RI850V4 processing was executed in association with the issued service call. |
|
|
When "processing program" has been selected in the Analysis information table area, this color indicates the processing interval that was executed first among the intervals shown by
Pressing the Toolbar buttons ( |


 .
. ,
,  , etc.) moves to the corresponding processing interval.
In this area, usage status of the real-time OS resource is indicated with the event marks below:


By dragging and dropping the mouse cursor in this area, the analysis information to be displayed in the Analysis information table area can be updated from "analysis information during the trace data acquisition period" to "analysis information during the analysis information extraction interval". |
To cancel "analysis information during the analysis information extraction interval," move the mouse cursor to within the Analysis information diagram area, and then double click on the left mouse button while pressing the [Ctrl] key.
For details on this operation, see section "2.4.6 Limiting range of usage status".
Specifies the period at which information is displayed in the Execution transition display area during the trace data acquisition period.
Left end of scroll bar is start position of trace data acquisition period. Right end of scroll bar is end position of trace data acquisition period.
Specifies to zoom in or out Execution transition display area.
When you drag slider to right, execution transition display area is zoomed in and when you drag slider to
left, execution transition display area is zoomed out.
To press the  button, Execution transition display area is zoomed in.
Displaying diagram is zoomed in and interval from Start time of execution transition display and End time of execution transition display become shorter.
To press the  button, Execution transition display area is zoomed out.
Displaying diagram is zoomed out and interval from Start time of execution transition display and End time of execution transition display become longer.
By using the mouse wheel with the [Ctrl] key pressed, the display within the Execution transition display area can be zoomed in or out. |
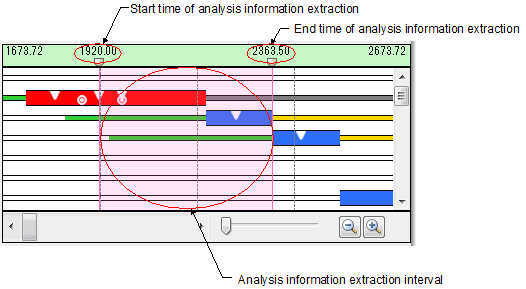
Elements which make up the analysis information extraction interval are as follows:
Displays the "time when trace data acquisition has been started" during the Analysis information extraction interval.
The Analysis information extraction interval can be changed by scrolling the  mark right under the extraction start time, in the same way as with the usual scroll bar.
Displays the "time when trace data acquisition has been finished" during the Analysis information extraction interval.
The Analysis information extraction interval can be changed by scrolling the  mark right under the extraction end time, in the same way as with the usual scroll bar.
Displays the execution transition state of the processing program and the real-time OS resource usage status during the Analysis information extraction interval.
The Analysis information extraction interval appears in magenta background.
This area is displayed overview as an execution transition state of the processing program wider than Execution transition display area in diagram form.
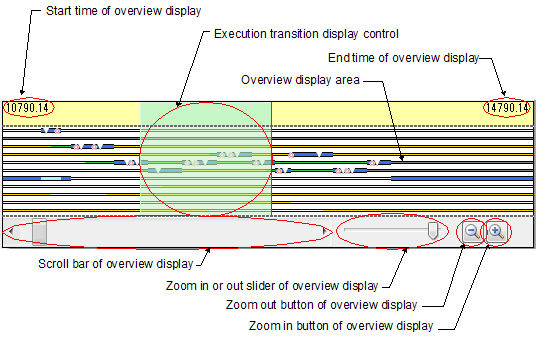
Displays start time of Overview display area.
Displays end time of Overview display area.
Displays the overview as an execution transition state of the processing program and real-time OS resource usage status for the displaying trace data specified by Zoom in or out slider of overview display or Zoom in button of overview display and Zoom in button of overview display.
Period which to display in the Overview display area can be changed from 1us to 100ms.
Displays the period at which information is displayed in the Execution transition display area during the trace data acquisition period.
In addition, by scrolling this control, in the Execution transition display area can be changed in the same way as with the usual scroll bar.
Specifies the period at which information is displayed in the Overview display area during the trace data acquisition period.
Left end of scroll bar is start position of trace data acquisition period. Right end of scroll bar is end position of trace data acquisition period.
Specifies to zoom in or out Overview display area.
When you drag slider to right, overview display area is zoomed in and when you drag slider to left, overview display area is zoomed out.
To press the  button, Overview display area is zoomed in.
Displaying diagram is zoomed in and interval from Start time of overview display and End time of overview display become shorter.
To press the  button, Overview display area is zoomed out.
Displaying diagram is zoomed out and interval from Start time of overview display and End time of overview display become longer.
By using the mouse wheel with the [Ctrl] key pressed, the display within the Overview display area can be zoomed in or out. |
By right-clicking on the mouse, the following context menu is displayed:
|
Switches the ratio in the CPU Usage Rate column to Total Ratio. When this menu has been selected, "the ratio of the total execution time of the processing program to the total execution time of all the processing programs" is displayed in the CPU Usage Rate column. |
|
|
Switches the ratio in the CPU Usage Rate column to User/Kernel Ratio. When this menu has been selected, "the ratio of the total execution time of the processing program to the total execution time of all the processing programs" is displayed in the CPU Usage Rate column in the following form: The ratio of the total execution time of the given processing program (excluding RI850V4 processing time associated with service call issuance) to the total execution time of all the processing programs. The ratio of the RI850V4 total processing time associated with service call issuance in the given processing program to the total execution time of all the processing programs. |
|
|
Opens the Editor panel and displays the source of the processing program. |
|
|
Opens the Disassemble panel and displays the disassemble results of the processing program. |
|
|
Highlights in red the portion representing the maximum continuous execution time of the processing program in the Analysis information diagram area. |
|
|
Highlights in red the portion representing the minimum continuous execution time of the processing program in the Analysis information diagram area. |