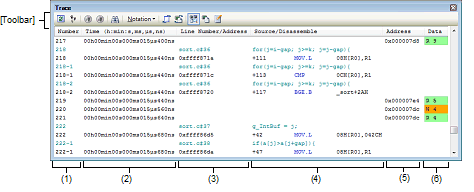
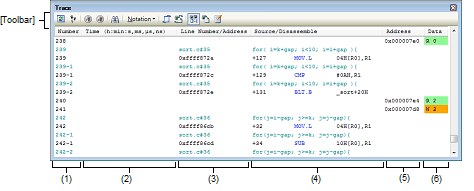
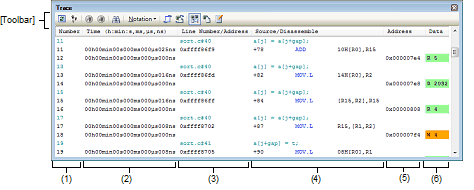
This panel displays the trace data which has had an execution history of the program recorded in it (see "2.13 Collecting an Execution History").
Although the trace data is displayed, by default, in a disassembled text and source text mixed mode, it is possible to display either one of these text by selecting the desired Display mode.
The display position is automatically updated after program execution is halted, so that the latest trace data will be displayed.
Note that this panel can be opened only when CS+ is connected with the debug tool.
[E20(JTAG) [RX600 Series]] |
By double-clicking a line delimiting each area on the panel, it is possible to change the relevant area to the smallest displayable width without omitting the content in it. |


This section describes the following.
On the Editor panel or Disassemble panel, select [Trace Settings] and then [Show Trace Result] on the context menu. |
This area displays the trace numbers that correspond to trace frames.
This area displays the time in "hour, minute, second, millisecond, microsecond and nanosecond" units from when the program started running till when the cause of instruction execution or memory access in any frame occurred.
[Simulator] |
[E1] [E20] [EZ Emulator] |
[E1] [E20] [EZ Emulator] |
[E1] [E20] [EZ Emulator] |
[E1(Serial)/E20(Serial)/EZ Emulator [RX200 Series]] |
The frequency for counting of timestamps in tracing varies (Trace clock count source[MHz]) with the microcontroller in use. |
Trace clock count source[MHz] = EXTAL × 8
Trace clock count source[MHz] = EXTAL × 4
(1) When EXTAL or PLL is used as the clock source for the system clock (ICLK)*
(a) When the division ratio of 1:1 is set by SCKCR.ICK
Trace clock count source[MHz] = Selected clock source /1
(b) When a division ratio other than 1:1 is set by SCKCR.ICK
Trace clock count source[MHz] = Selected clock source /1
(2) When EXTAL or PLL is not used as the clock source for the system clock (ICLK)
Trace clock count source[MHz] = Selected clock source /1
Trace clock count source[MHz] = ICLK (using the performance measurement counter)
*When the clock source for the system clock (ICLK) is changed while the user program is running, the count source for timestamps will also change. In such a case, simply multiplying the timestamp difference and the frequency does not make the absolute time.
This area displays the address of an assembly instruction or a line number in the source file.
The desired notation (numerical representation) or character string encoding can be selected by clicking the appropriate toolbar button or by selecting from a context menu.
The display form is as follows:
Since the following execution histories are not displayed, the line numbers are not consecutive. |
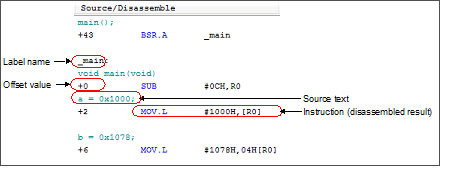
This area displays collected trace data as shown below.
Note that the items displayed in this area differ with each display mode selected (see "(a) Display mode").

|
If a label is defined at an address, the label name is displayed. |
||
|
If no label is defined at an address, an offset value from the nearest label is displayed. |
||
|
If Mixed display mode or Source display mode is selected, the corresponding source text is displayed. However, if a location without debug information is executed, the text "No Debug Information" is displayed. |
||
|
If Mixed display mode or Disassemble display mode is selected, the corresponding instruction (disassembled result) is displayed. The mnemonic is highlighted. |
||
If collection of trace data failed, with some data dropped, the word "(LOST)" is displayed and the whole of the relevant line is displayed in an error color. (The error color depends on how the [General - Font and Color] category in the Option dialog box is set.) |
This area has the following features:
One of the following three display modes can be selected by clicking the appropriate toolbar button or by selecting from a context menu.
When [Jump to Source] on the context menu is selected, the Editor panel is opened, with the caret on it moved to a source line that corresponds to the line where the caret is currently positioned. (If the Editor panel is already open, CS+ jumps to it directly.)
Similarly, when [Jump to Disassemble] is selected, the Disassemble panel (Disasemmble1) is opened, with the caret on it moved to a fetch address on the line where the caret is currently positioned. (If the Disassemble panel (Disassemble1) is already open, CS+ jumps to it directly.)
By clicking the  or
or  button in the toolbar or selecting [Window Connecting] and then [Connect Source Window] or [Connect Disassemble Window] on the context menu, it is possible to have data corresponding to the address at the caret position on this panel displayed in synchronism with it on the Editor panel or Disassemble panel. (The focus is not moved.)
When the mouse cursor is hovered on a line, the data in all areas (items) corresponding to the line are displayed one below another in a popup window.
By choosing [Save Trace Data As...] from the [File] menu, it is possible to open the Data Save dialog box and then save the content of this panel to a text file (*.txt) or CSV file (*.csv).
For details on how to save trace data, see "2.13.9 Saving the displayed content of an execution history."
To zoom in and out of the Trace panel view, change the zoom ratio by using the drop-down list on the toolbar of the Main window while the focus is placed in the Trace panel.
You can also change the zoom ratio by using the [Ctrl] key + mouse-wheel combination.
Using the [Ctrl] key + mouse-wheel forward will zoom into the view, making the contents larger and easier to see (max. 300%). |
Using the [Ctrl] key + mouse-wheel backward will zoom out of the view, making the contents smaller (min. 50%). |
If the panel is closed after the zoom ratio is changed, the changed zoom ratio is retained (next time, the panel will open at the changed zoom ratio).
This area displays the subject address at which a memory access was made.
However, if an access was made to an I/O register, the I/O register name is displayed in place of an address. (If there are multiple accesses, the rest is displayed on the next line.)
The desired notation (numerical representation) can be selected by clicking the appropriate toolbar button or by selecting from a context menu.
This area displays an accessed data value and the type of access.
However, this information is not displayed for accesses to the CPU register.
The desired notation (numerical representation) or character string encoding can be selected by clicking the appropriate toolbar button or by selecting from a context menu.
The display forms of data values and types of access are shown below. (The colors in which text and backgrounds are displayed depend on how the [General - Font and Color] category of the Option dialog box are set.)
|
Acquires latest information from the debug tool to update the display. |
||
|
Clears (initializes) the trace memory and also clears the display of this panel. |
||
|
Restarts the trace function that was halted during program execution. However, this is disabled when the program is halted or when tracer operation is underway. |
||
|
Temporarily stops the trace function during program execution. However, this is disabled when the program is halted or when the tracer is halted. |
||
|
Opens the Trace Search dialog box. |
||
|
Shows the following buttons for changing the form in which values are displayed. |
||
|
Scrolls the Editor panel in synchronism with a selected line. |
||
|
Scrolls the Disassemble panel in synchronism with a selected line. |
||
|
Changes the display mode to a Mixed display mode (default). |
||
|
Changes the display mode to a Disassemble display mode. |
||
|
Changes the display mode to a Source display mode. |
||
[[File] Menu (Trace Panel-Only Items)]
The [File] menu used exclusively for the Trace panel is as follows. (The other items are shared.)
However, all of these items are disabled during program execution.
|
Saves the content of trace data to a text file (*.txt) or CSV file (*.csv) that has been saved previously (see "(e) Saving of trace data"). If this item is selected for the first time after startup, the same operation as [Save Trace Data As...] would have been selected is performed. |
|
|
Opens the Data Save dialog box in order to save the content of trace data to a specified text file (*.txt) or CSV file (*.csv) (see "(e) Saving of trace data"). |
[[Edit] Menu (Trace Panel-Only Items)]
The [Edit] menu used exclusively for the Trace panel is as follows. (All other items are disabled.)
However, all of these items are disabled during program execution.
|
Copies the content of a selected line as a character string to the clipboard (multiple selection not accepted). |
|
|
Opens the Trace Search dialog box. |
|
Clears (initializes) the trace memory and also clears the display of this panel. |
||
|
Restarts the trace function that was halted during program execution. However, this is disabled when the program is halted or when tracer operation is underway. |
||
|
Temporarily stops the trace function during program execution. However, this is disabled when the program is halted or when the tracer is halted. |
||
|
Opens the Trace Search dialog box. |
||
|
Copies the content of a selected line as a character string to the clipboard (multiple selection not accepted). |
||
|
Changes the display mode to a Mixed display mode. |
||
|
Changes the display mode to a Disassemble display mode. |
||
|
Changes the display mode to a Source display mode. |
||
|
Shows the following cascaded menu to specify notation (numerical representation). |
||
|
Shows the following cascaded menu to link the display with other panels (see "(c) Linkage with other panels"). |
||
|
Scrolls the Editor panel in synchronism with a selected line. |
||
|
Scrolls the Disassemble panel in synchronism with a selected line. |
||
|
Opens the Disassemble panel (Disassemble1), with the caret on it moved to the fetch address on a selected line. |
||
|
Opens the Editor panel, with the caret on it moved to the source line corresponding on a selected line. |
||
|
Opens the Memory panel, with the caret on it moved to the memory value corresponding to the line where the caret is positioned. |
||


