19. Productivity Tips
19.1. Alternative ways for opening a project in VSCode
There are 2 different alternatives to open a project in VS Code:
Using the [File: Open Folder…] command in the [Command Palette]:
Select [View] → [Command Palette…] menu item.
Select [File: Open Folder…] command (can filter the command list using command name).
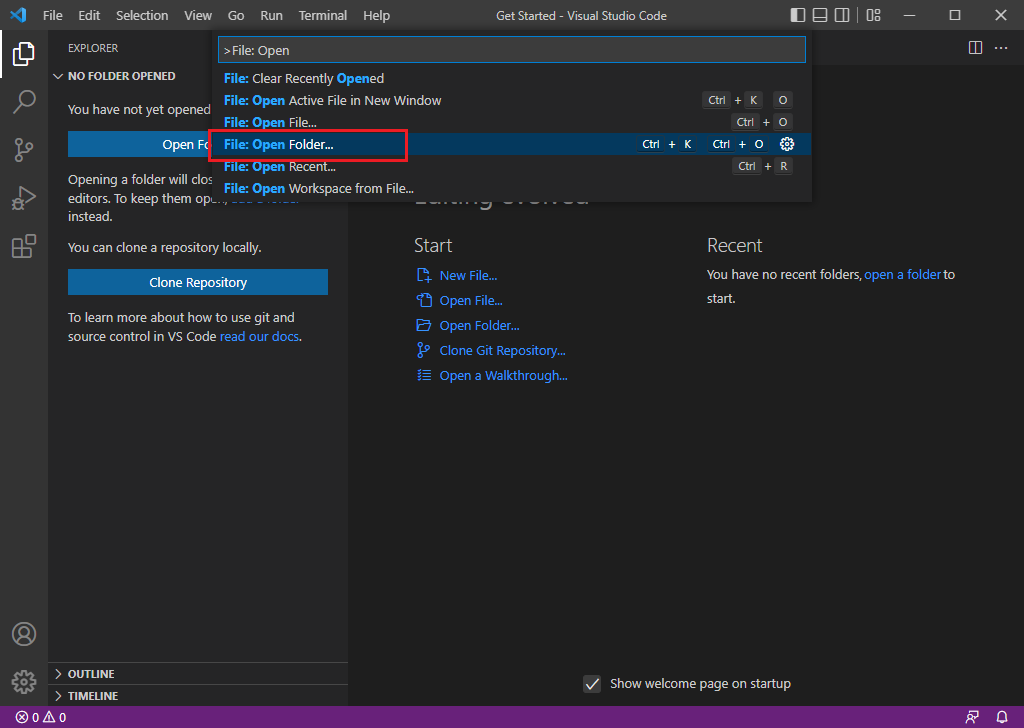
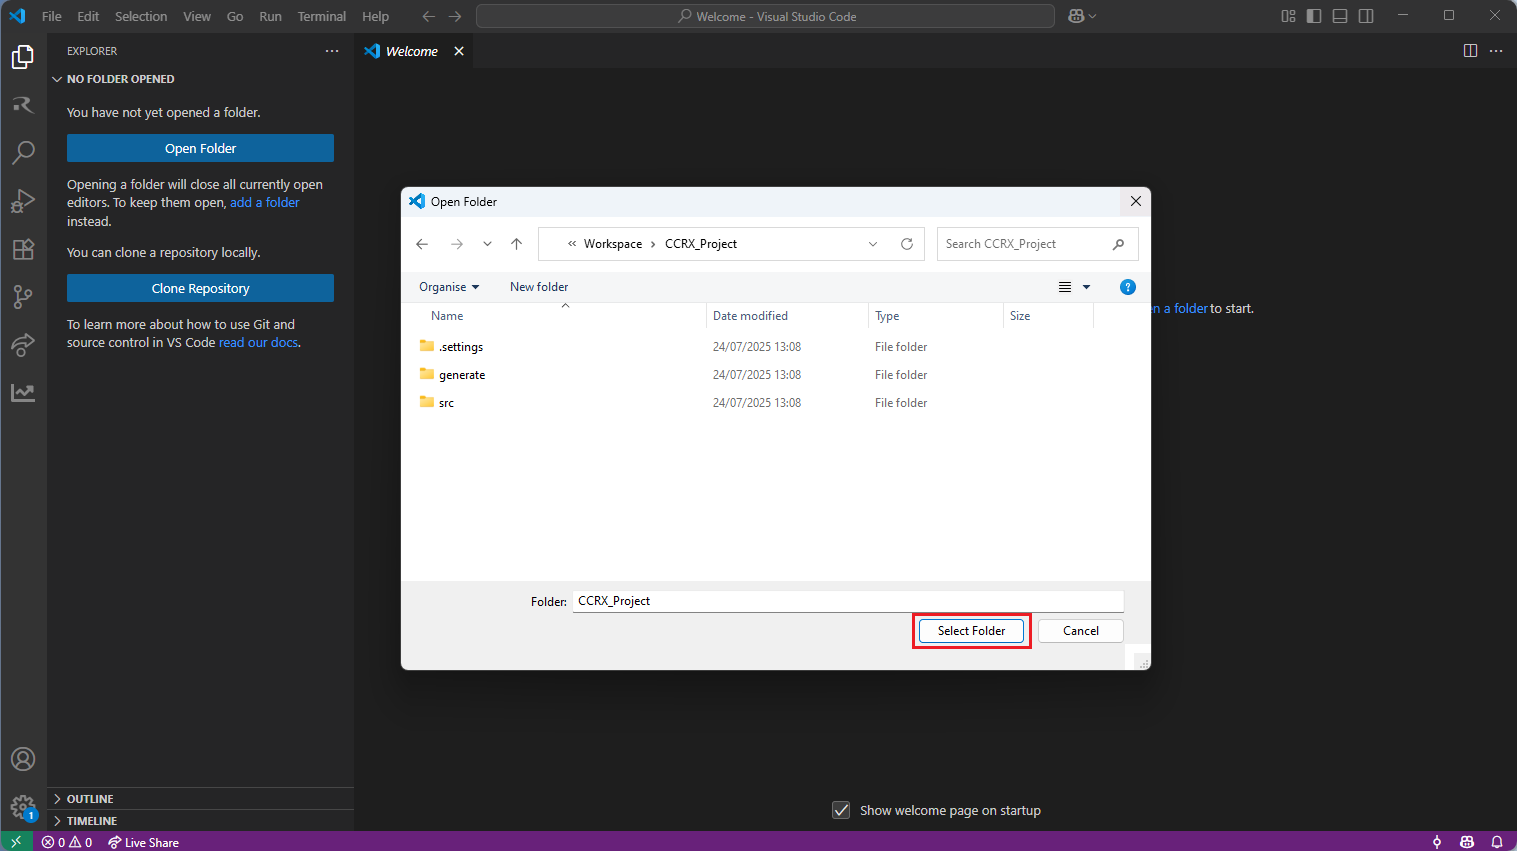
In [Open Folder] dialog, browse to project folder and click [Select Folder] button.
Using command-line:
Folder can be opened using the below command-line option.
code <folder path>
E.g. (provide the cmd is opened in the folder that contains CCRX_testprj folder)
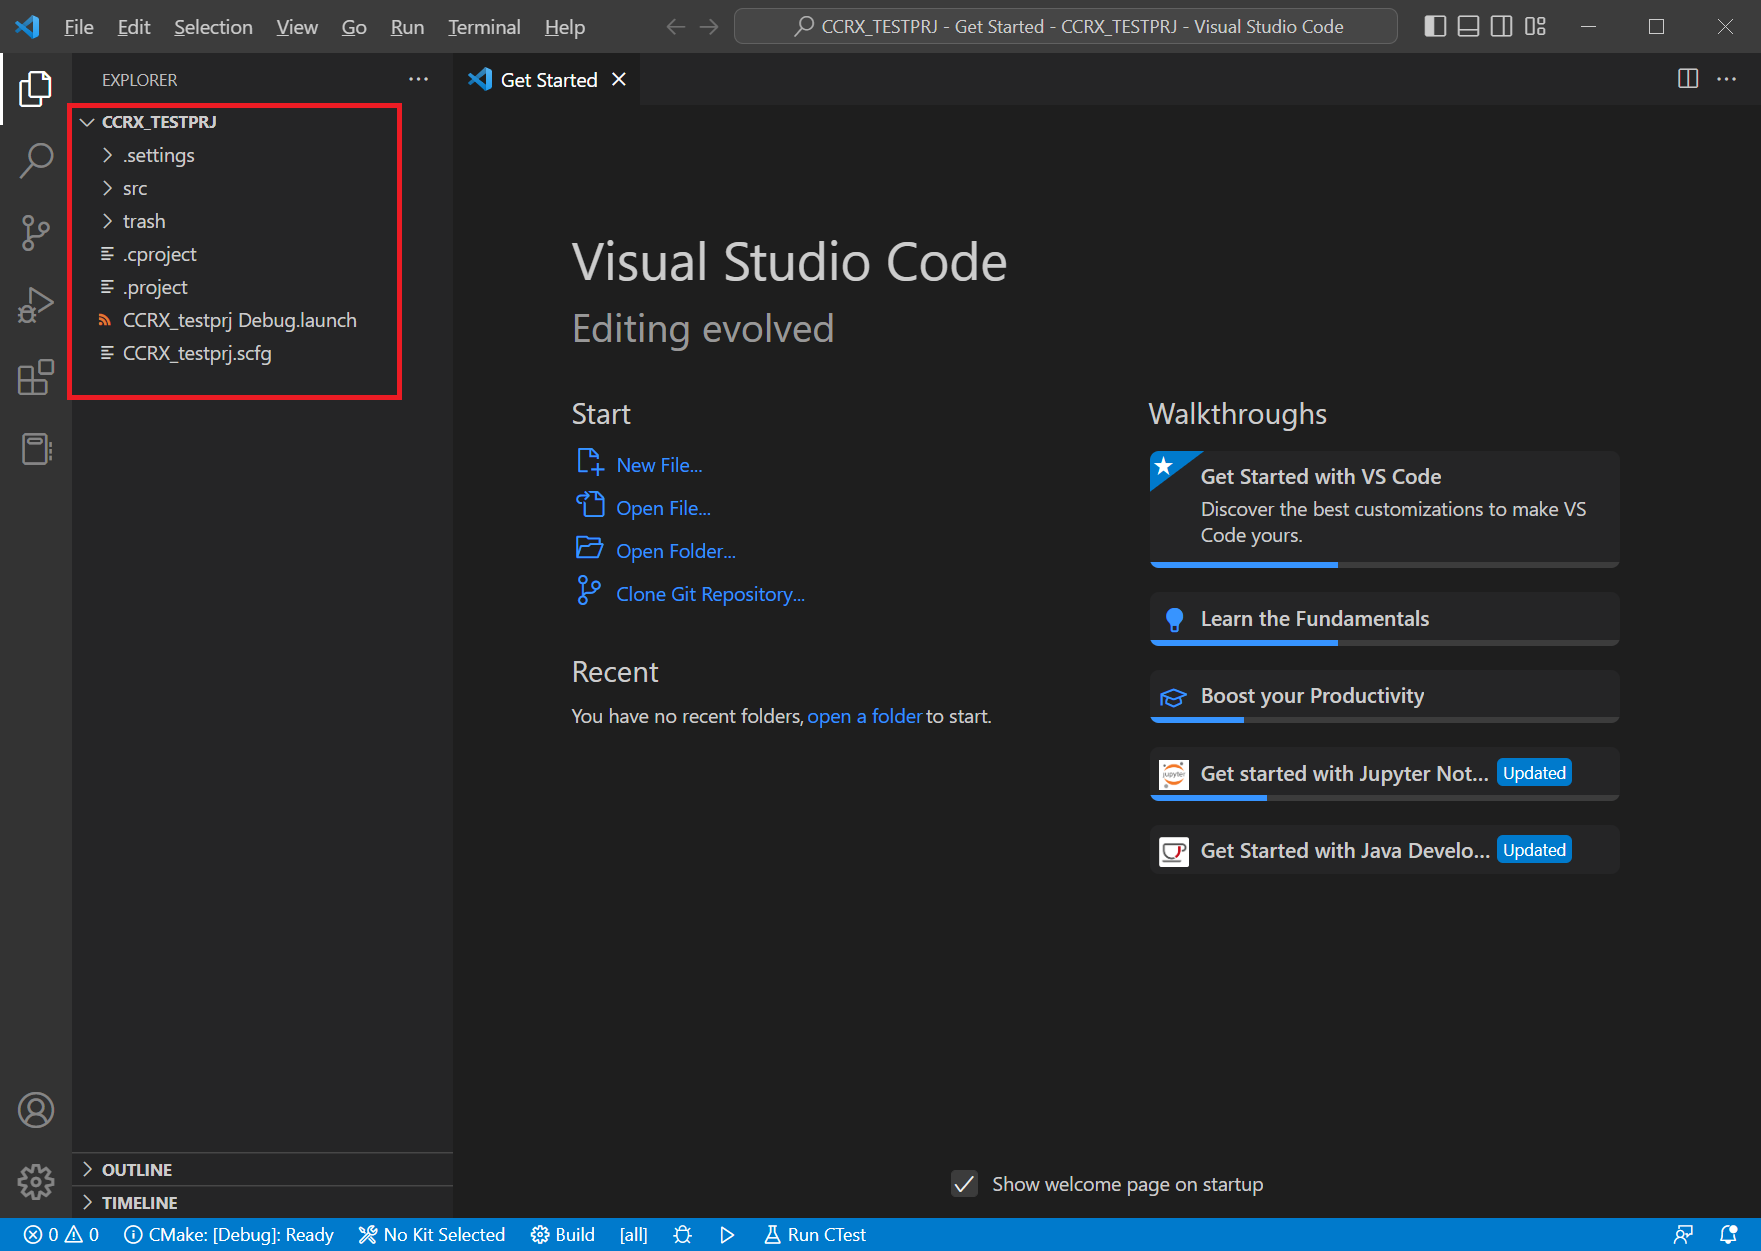
code CCRX_testprj/Project will be opened and display in [Explorer] view.
Multiple folder paths can be provided on the command line to open multiple folders at once.
code CCRX_testprj/ CCRL_testprj/ RA_testprj/
19.2. Debuggers, Device Families and Emulator/Simulator Types in launch.json
The minimum configuration of the launch configuration is shown below:
launch.json format
 1{
 2    // Use IntelliSense to learn about possible attributes.
 3    // Hover to view descriptions of existing attributes.
 4    // For more information, visit: https://go.microsoft.com/fwlink/?linkid=830387
 5    "version": "0.2.0",
 6    "configurations": [
 7        {
 8            "type": "<type>",
 9            "request": "launch",
10            "name": "<display name of the configuration>",
11            "target": {
12                "deviceFamily": "<device family (RA, RCAR, RH850, RISC-V MCU, RL78, RX or RZ)>",
13                "device": "<device code>",
14                "debuggerType": "<debugger type (type of the simulator or emulator)>"
15            }
16        }
17    ]
18}
Here is the lookup table for “type”, “target.deviceFamily” and “target.debuggerType” values for the developers to use in the launch.json configuration file:
Debugger |
type |
target.deviceFamily |
target.debuggerType |
|---|---|---|---|
Renesas GDB Hardware Target |
renesas-hardware |
Dialog |
SEGGERJLINKARM |
RA |
E2, E2LITE, SEGGERJLINKARM |
||
RCAR |
E2ARM, E2RH850, IE850ARH850, LAUTERBACHT32 |
||
RH850 |
E1, E2, IE850ARH850 |
||
RISC-V MCU |
E2, E2LITE, SEGGERJLINKRISCV |
||
RL78 |
E1, E2, E2LITE, IECUBE, COMPORT |
||
RX |
E1, E2, E2LITE, E20, SEGGERJLINKRX |
||
RZ |
SEGGERJLINKARM |
||
Renesas GDB Simulator Target |
renesas-simulator |
RL78 |
SIMULATOR |
RX |
SIMULATOR |
||
Renesas RCAR Linux Target |
renesas-rcar-linux |
RCAR |
RCAR_PROXY, SIMULATOR, CVE |
19.3. Developing with Multiple Different Toolchain Versions
If you are developing projects for multiple device families simultaneously, when projects require different versions of Arm GNU Toolchain, it might be better to define this environment variables in the shell that VS Code launched so that each project can be built with the intended toolchain version.
For Windows:
In a terminal window, first, set the ARM_GCC_TOOLCHAIN_PATH variable, then type code to open the VS Code IDE.
set ARM_GCC_TOOLCHAIN_PATH=<bin folder of the Arm GNU Toolchain>
code
For example:
set ARM_GCC_TOOLCHAIN_PATH=C:\Toolchains\arm-gnu-toolchain-13.2.Rel1-x86_64-arm-none-eabi\bin
code
For Linux and macOS:
In a terminal window, first, set the ARM_GCC_TOOLCHAIN_PATH variable, then type code to open the VS Code IDE.
export ARM_GCC_TOOLCHAIN_PATH="<bin folder of the Arm GNU Toolchain>"
code
For example:
export ARM_GCC_TOOLCHAIN_PATH="/home/renesas/arm-gnu-toolchain-13.2.Rel1-x86_64-arm-none-eabi/bin"
code
Note
After opening the VS Code from the terminal as explained above, please be aware that opening an additional VS Code window using “File” -> “New Window” menu may not inherit the defined ARM_GCC_TOOLCHAIN_PATH value. In order to verify the injected value, you can use “Terminal” => “New Terminal” menu to open the integrated VS Code terminal and then use the following echo command for the Windows Operating Systems:
echo %ARM_GCC_TOOLCHAIN_PATH%
or, the following echo command for the Linux and macOS Operating Systems:
echo $ARM_GCC_TOOLCHAIN_PATH
19.4. Enabling/Disabling Cores in Multi-core Devices
When debugging with multi-core, all cores are enabled by default. The user can configure the disabledCores property in the launch.json configuration file’s target to disable the desired cores.
For instance, in the case of the R-Car S4 ARM CA55 device, there are 8 cores ranging from CA55CPU0 to CA55CPU7. To disable cores CA55CPU4 to CA55CPU7, the following configuration should be applied:
launch.json example:
 1{
 2  // Use IntelliSense to learn about possible attributes.
 3  // Hover to view descriptions of existing attributes.
 4  // For more information, visit: https://go.microsoft.com/fwlink/?linkid=830387
 5  "version": "0.2.0",
 6  "configurations": [
 7    {
 8      "type": "renesas-hardware",
 9      "request": "launch",
10      "name": "RCAR",
11      "program": "${cwd}/Debug/MR_BAREMETAL_CA55.axf",
12      "target": {
13        "deviceFamily": "RCAR",
14        "device": "R8A779F0_CA55",
15        "debuggerType": "E2ARM",
16        "disabledCores": ["CA55CPU4","CA55CPU5","CA55CPU6","CA55CPU7"]
17      }
18    }
19  ]
20}
19.5. GDB Parameters
Renesas Debug extension is initializing and passing all required command line arguments to gdb process while starting the debug session. Furthermore, if it’s needed, Renesas Debug Adapters provide injecting additional command line arguments for gdb, which will be passed to the gdb while starting the debug session. Passing the additional gdb command line arguments operation is a straight-forward process, it can be done by defining gdbArguments field to the debug configuration in launch.json file.
The following code is showing an example how gdbArguments field could be defined in launch configuration:
launch.json example:
 1{
 2  // Use IntelliSense to learn about possible attributes.
 3  // Hover to view descriptions of existing attributes.
 4  // For more information, visit: https://go.microsoft.com/fwlink/?linkid=830387
 5  "version": "0.2.0",
 6  "configurations": [
 7    {
 8      "type": "renesas-simulator",
 9      "request": "launch",
10      "name": "Sample Renesas Configuration",
11      "gdbArguments": ["-rx-force-isa=v3"],
12      "target": {
13        "deviceFamily": "RX",
14        "device": "R5F566TK",
15        "debuggerType": "SIMULATOR"
16      }
17    }
18  ]
19}
19.6. GDB Server Parameters
Renesas VS Code extensions will automatically inject default values required to be passed to GDB server in debug session. On the other hand, it is possible to override GDB server parameters passed in debug session. For this purpose, serverParameters option could be used to pass the custom GDB server parameters.
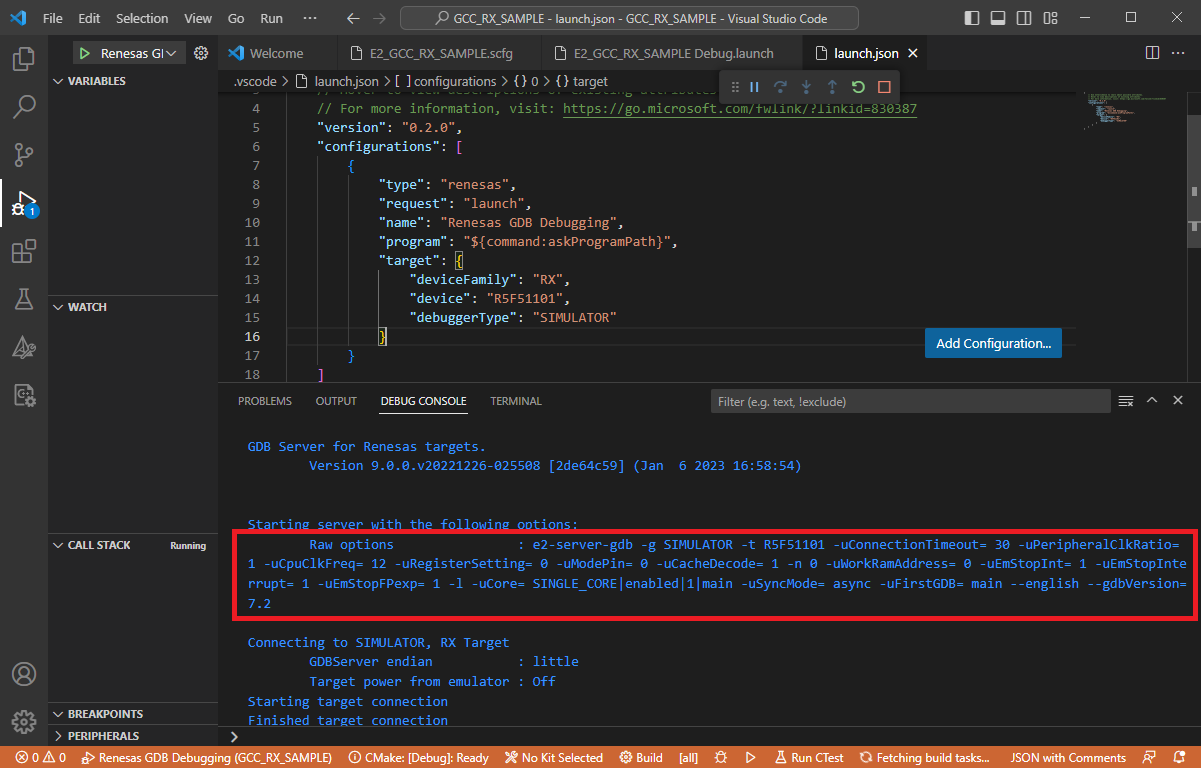
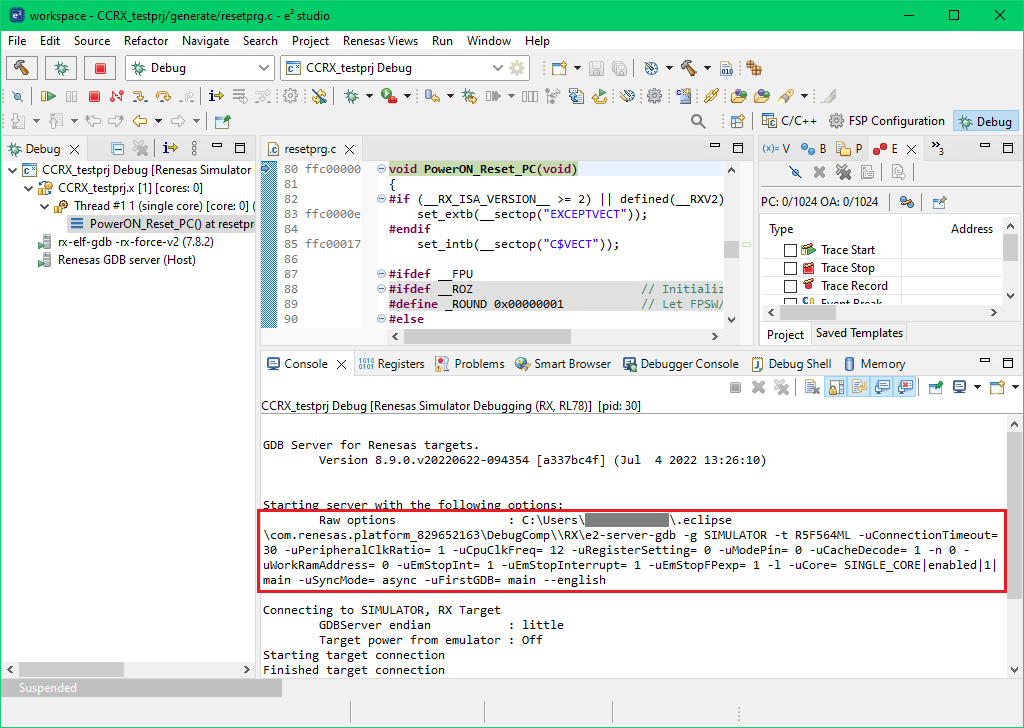
First, developer need to find the device family/device specific parameters and their default values. It could accessed by starting debug session started with a default configuration like shown below in VS Code. After the start of the debug session, the server parameters shown in the flow of [DEBUG CONSOLE] panel, with line starting with [Raw options] text.
Then, the raw options list needs to be converted to serverParameters array. The example for this operation is shown below:
raw options:
e2-server-gdb -g SIMULATOR -t R5F51101 -uConnectionTimeout= 30 -uPeripheralClkRatio= 1 -uCpuClkFreq= 12 -uRegisterSetting= 0 -uModePin= 0 -uCacheDecode= 1 -n 0 -uWorkRamAddress= 0 -uEmStopInt= 1 -uEmStopInterrupt= 1 -uEmStopFPexp= 1 -l -uCore= SINGLE_CORE|enabled|1|main -uSyncMode= async -uFirstGDB= main --english --gdbVersion= 7.2
serverParameters array:
"serverParameters" : ["-uConnectionTimeout=", "30", "-uPeripheralClkRatio=", "1", "-uCpuClkFreq=", "12", "-uRegisterSetting=", "0", "-uModePin=", "0", "-uCacheDecode=", "1", "-n", "0", "-uWorkRamAddress=", "0", "-uEmStopInt=", "1", "-uEmStopInterrupt=", "1", "-uEmStopFPexp=", "1", "-l", "-uSyncMode=", "async", "-uFirstGDB=", "main", "--english", "--gdbVersion=", "7.2"]
Note: Please note that -g parameter which is defined as debuggerType, and -t parameter which is defined as device on target parameters of launch configuration; and -uCore= parameter which is injected by Renesas VS Code Extension itself removed from the list and they should not be passed in serverParameters array.
At last, the parameter array could be passed via serverParameters in target configuration.
launch.json example for overriding GDB server parameters
 1{
 2  // Use IntelliSense to learn about possible attributes.
 3  // Hover to view descriptions of existing attributes.
 4  // For more information, visit: https://go.microsoft.com/fwlink/?linkid=830387
 5  "version": "0.2.0",
 6  "configurations": [
 7    {
 8      "type": "renesas-simulator",
 9      "request": "launch",
10      "name": "Renesas GDB Debugging",
11      "program": "${command:askProgramPath}",
12      "target": {
13        "deviceFamily": "RX",
14        "device": "R5F51101",
15        "debuggerType": "SIMULATOR",
16        "serverParameters": ["-uConnectionTimeout=", "30", "-uPeripheralClkRatio=", "1", "-uCpuClkFreq=", "12", "-uRegisterSetting=", "0", "-uModePin=", "0", "-uCacheDecode=", "1", "-n", "0", "-uWorkRamAddress=", "0", "-uEmStopInt=", "1", "-uEmStopInterrupt=", "1", "-uEmStopFPexp=", "1", "-l", "-uSyncMode=", "async", "-uFirstGDB=", "main", "--english", "--gdbVersion=", "7.2"]
17      }
18    }
19  ]
20}
It is not required to pass all the parameters in the launch.json file while overriding the parameters. Developer can choose necessary parameters and override their values by passing them with their new values through serverParameters, parameters that do not require value change does not need to be defined again.
For example, to only change -uConnectionTimeout= parameter the following configuration could be used:
launch.json example for overriding GDB server parameters
 1{
 2  // Use IntelliSense to learn about possible attributes.
 3  // Hover to view descriptions of existing attributes.
 4  // For more information, visit: https://go.microsoft.com/fwlink/?linkid=830387
 5  "version": "0.2.0",
 6  "configurations": [
 7    {
 8      "type": "renesas-simulator",
 9      "request": "launch",
10      "name": "Renesas GDB Debugging",
11      "program": "${command:askProgramPath}",
12      "target": {
13        "deviceFamily": "RX",
14        "device": "R5F51101",
15        "debuggerType": "SIMULATOR",
16        "serverParameters": ["-uConnectionTimeout=", "120"]
17      }
18    }
19  ]
20}
Alternatively, it is also possible for to use a project created and built in e 2 studio to get the GDB server parameters. For this purpose, start a debug session in e 2 studio, then, the GDB server parameters will be displayed in [Console] with line starting with [Raw options] text.
19.6.1. Mandatory parameters
The mandatory parameters required to connect to the target device are automatically provided to the Renesas GDB server by the adapter. Users do not need to define or send these parameters manually.
Option |
Details |
|
Description: Specify the emulator type.
Available Values: E1, E20, E2, E2LITE, EZ, IECUBE, COMPORT, SEGGERJLINKARM, or SEGGERJLINKRX.
Example:
"serverParameters": { "-g": "E2" } |
|
Description: Specify the target device name.
Available Values: Any valid Target Device name for the selected emulator.
Example:
"serverParameters": { "-t": "R7FA6E10F" } |
19.6.2. Renesas GDB Server Settings
Option |
Details |
|
Description: Add arguments from the specific file to Renesas GDB server.
Default Values: None
Available Values: The path to argument file
Example:
"serverParameters": { "-c": "D:\\argument.txt" } |
|
Description: Specify the port number that Renesas GDB server will open.
Default Values: If this parameter is not sent to Renesas GDB server, a random available port will be chosen.
Available Values: Valid available port number
Example:
"serverParameters": { "-p": 61234 } |
|
Description: Specify whether there is no thread on launch or not.
Default Values: No
Available Values: Does not have a value. Sending this parameter means “Yes”
Example:
"serverParameters": { "-m": true } |
|
Description: Specify the type of data endian.
Default Values: 0
Available Values: 0: Little Endian, 1: Big Endian
Example:
"serverParameters": { "-n": 0 } |
|
Description: Specify language to English.
Example:
"serverParameters": { "--english": true } |
|
Description: Specify language to Japanese.
Example:
"serverParameters": { "--japanese": true } |
|
Description: Specify the connection timeout value in seconds. If the connection from GDB server is not established within the timeout value, Renesas GDB server will cancel the connection process.
Default Values: 0
Available Values: Non-negative integer, less than 300 (seconds)
Example:
"serverParameters": { "-uConnectionTimeout=": 30 }Note: If value of this parameter is 0, it means Renesas GDB server will wait infinitely.
|
|
Description: Specify the synchronization between cores.
Default Values: sync
Available Values: sync: Synchronous mode, async: Asynchronous mode
Example:
"serverParameters": { "-uSyncMode=": "async" } |
|
Description: Specify core’s information of the target device to Renesas GDB server.
Default Values: None
Available Values: Core’s information with format: <core name>|<status>|<thread>|<GDB port>
Example:
"serverParameters": { "-uCore=": "CR52CPU0|enabled|264|61234" }Note: If the core status value is not sent, this core status will be set to “enabled” as default.
|
Note
Core’s information details
Format:
<core name>|<status>|<thread>|<GDB port>core name: - If it is a single core:
SINGLE_CORE. - Otherwise:<cortex family><order of CPU>, example:CR52CPU0means cortex CR52, CPU 0.status: -
enabled– The core is enabled. -disabled– The core is disabled. -freerunning– The core is free running.thread: - Specify the number of threads the core is running in.
GDB port: - Specify the GDB port number.
19.7. Managing Initial Breakpoint
The Renesas Debug Adapters, set a default initial breakpoint at the entrance of the main function while initialising the debug session. This enables the debug session to stop at the program entry point by default when a debug session started. The setting of the default initial breakpoint can be changed by using the initialBreakpointAt launch parameter in the target definition which is defined in the launch.json configuration. By setting a different function name, the initial breakpoint can target to a different function. For instance, you may target the hal_entry function by setting the configuration like below:
Example for setting the initial breakpoint at hal_entry function:
 1{
 2  // Use IntelliSense to learn about possible attributes.
 3  // Hover to view descriptions of existing attributes.
 4  // For more information, visit: https://go.microsoft.com/fwlink/?linkid=830387
 5  "version": "0.2.0",
 6  "configurations": [
 7    {
 8      "type": "renesas-hardware",
 9      "request": "launch",
10      "name": "Renesas GDB Debugging",
11      "target": {
12        "deviceFamily": "RA",
13        "device": "R7FA2E1A9",
14        "debuggerType": "SEGGERJLINKARM",
15        "initialBreakpointAt": "hal_entry"
16      }
17    }
18  ]
19}
The default initial breakpoint can also be disabled by setting the value to null.
Example for disabling the default initial breakpoint:
 1{
 2  // Use IntelliSense to learn about possible attributes.
 3  // Hover to view descriptions of existing attributes.
 4  // For more information, visit: https://go.microsoft.com/fwlink/?linkid=830387
 5  "version": "0.2.0",
 6  "configurations": [
 7    {
 8      "type": "renesas-hardware",
 9      "request": "launch",
10      "name": "Renesas GDB Debugging",
11      "target": {
12        "deviceFamily": "RA",
13        "device": "R7FA2E1A9",
14        "debuggerType": "SEGGERJLINKARM",
15        "initialBreakpointAt": null
16      }
17    }
18  ]
19}
19.8. Managing Python Directory
In a debug session, RA, RH850, RISC-V MCU, RL78, RX and RZ device families require Python 3.10, on the other hand, R-Car requires a 32-bit version of Python 2.7. The path of Python is automatically selected if the path is already included in environment variable PATH.
Note
For Windows, Renesas Debug extension automatically extracts a local copy of the required version of Python into the support files folder if Python is not installed or included in the PATH.
For advanced operations where the Python path doesn’t wanted to be defined in the environment variable PATH, the launch parameter pythonHome could be used for setting the Python directory to be used during the debugging session.
Example for pythonHome usage:
 1{
 2  // Use IntelliSense to learn about possible attributes.
 3  // Hover to view descriptions of existing attributes.
 4  // For more information, visit: https://go.microsoft.com/fwlink/?linkid=830387
 5  "version": "0.2.0",
 6  "configurations": [
 7    {
 8      "type": "renesas-simulator",
 9      "request": "launch",
10      "name": "Renesas GDB Simulator Debugging",
11      "pythonHome": "C:\\Path\\To\\Python",
12      "target": {
13        "deviceFamily": "RX",
14        "device": "R5F51115",
15        "debuggerType": "SIMULATOR"
16      }
17    }
18  ]
19}
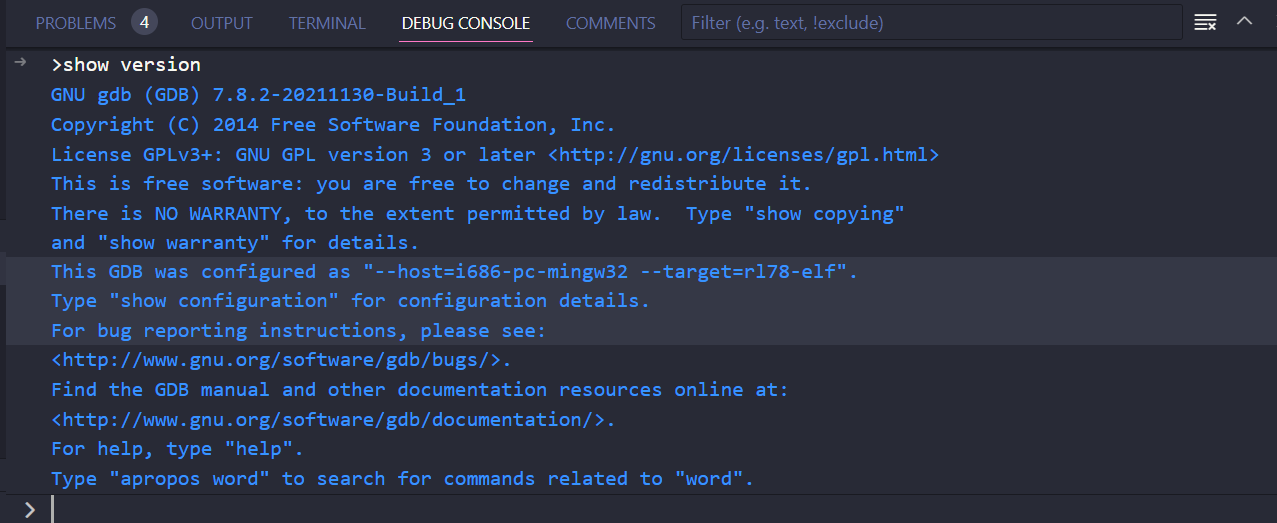
19.9. Monitoring MI Commands
In the Debug Console view you can interact directly with GDB. To display the value of an expression, type that expression which can reference variables that are in scope. For example type ‘2 + 3’ or the name of a variable. Arbitrary commands can be sent to GDB by prefixing the input with a ‘>’, for example type ‘>show version’ or ‘>help’.
19.10. Using Additional Images during Debug Session
Note
Available for renesas-hardware and renesas-simulator debug adapters.
Loading images in a Renesas Debug session is managed by the program and the images launch properties. In default configuration, both program and images are optional. During the session initialisation, the Renesas Debug adapters handle the image loading operation with the following rules:
If program is defined, then the Renesas Debug extension considers the program as the main image to be loaded into the device while starting the debug session.
 1{
 2  // Use IntelliSense to learn about possible attributes.
 3  // Hover to view descriptions of existing attributes.
 4  // For more information, visit: https://go.microsoft.com/fwlink/?linkid=830387
 5  "version": "0.2.0",
 6  "configurations": [
 7    {
 8      "type": "renesas-hardware",
 9      "request": "launch",
10      "name": "Renesas GDB Debugging",
11      "program": "${workspaceFolder}/build/Debug/RA2E1.elf",
12      "target": {
13        "device": "R7FA2E1A9",
14        "deviceFamily": "RA",
15        "debuggerType": "SEGGERJLINKARM"
16      }
17    }
18  ]
19}
If program is not explicitly defined, then the Renesas Debug extension is resolving the program path automatically by searching the possible images inside the project folder. If multiple images are found, a selection will be shown to the users while starting the debug session.
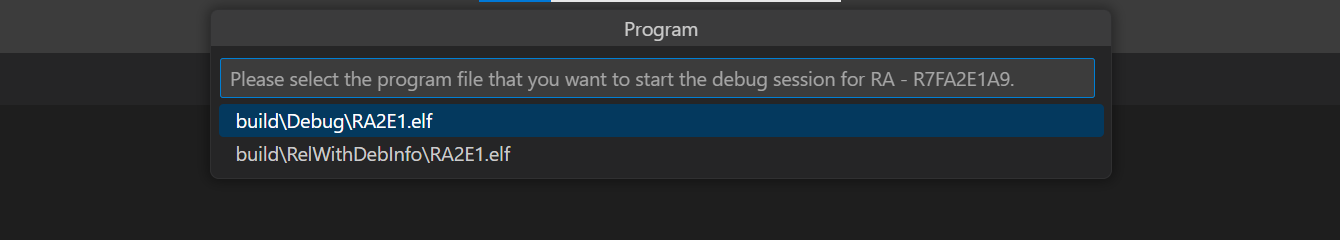
 1{
 2  // Use IntelliSense to learn about possible attributes.
 3  // Hover to view descriptions of existing attributes.
 4  // For more information, visit: https://go.microsoft.com/fwlink/?linkid=830387
 5  "version": "0.2.0",
 6  "configurations": [
 7    {
 8      "type": "renesas-hardware",
 9      "request": "launch",
10      "name": "Renesas GDB Debugging",
11      "target": {
12        "device": "R7FA2E1A9",
13        "deviceFamily": "RA",
14        "debuggerType": "SEGGERJLINKARM"
15      }
16    }
17  ]
18}
If images are defined, then the additional images will be loaded into the device after loading the program. The images are loaded in the given order after the program.
 1{
 2  // Use IntelliSense to learn about possible attributes.
 3  // Hover to view descriptions of existing attributes.
 4  // For more information, visit: https://go.microsoft.com/fwlink/?linkid=830387
 5  "version": "0.2.0",
 6  "configurations": [
 7    {
 8      "type": "renesas-hardware",
 9      "request": "launch",
10      "name": "Renesas GDB Debugging",
11      "images": [
12        {
13          "file": "${workspaceFolder}/images/data.bin",
14          "type": "binary",
15          "offset": "0x1000"
16        }
17      ],
18      "target": {
19        "device": "R7FA2E1A9",
20        "deviceFamily": "RA",
21        "debuggerType": "SEGGERJLINKARM"
22      }
23    }
24  ]
25}
In some cases, it may be required to change the order of the loading, and it may be necessary to load other images before loading the program. In such a case, the program image can be defined inside the images definition. This can be done by setting “program”: true in the desired image definition. In such a case, the main program definition will be ignored (even if it is defined in the launch configuration), and the image which is marked as program will be considered as the main program.
 1{
 2  // Use IntelliSense to learn about possible attributes.
 3  // Hover to view descriptions of existing attributes.
 4  // For more information, visit: https://go.microsoft.com/fwlink/?linkid=830387
 5  "version": "0.2.0",
 6  "configurations": [
 7    {
 8      "type": "renesas-hardware",
 9      "request": "launch",
10      "name": "Renesas GDB Debugging",
11      "images": [
12        {
13          "file": "${workspaceFolder}/images/data.bin",
14          "type": "binary",
15          "offset": "0x1000"
16        },
17        {
18          "file": "${workspaceFolder}/build/Debug/RA2E1.elf",
19          "type": "image-and-symbols",
20          "program": true
21        }
22      ],
23      "target": {
24        "device": "R7FA2E1A9",
25        "deviceFamily": "RA",
26        "debuggerType": "SEGGERJLINKARM"
27      }
28    }
29  ]
30}
For multicore images, the coreName property is required to associate each image with its corresponding core.
 1{
 2  // Use IntelliSense to learn about possible attributes.
 3  // Hover to view descriptions of existing attributes.
 4  // For more information, visit: https://go.microsoft.com/fwlink/?linkid=830387
 5  "version": "0.2.0",
 6  "configurations": [
 7    {
 8      "type": "renesas-hardware",
 9      "request": "launch",
10      "name": "Renesas GDB Debugging",
11      "images": [
12        {
13          "file": "${workspaceFolder}/build/Debug/R8A779F0_CA55_CPU0.elf",
14          "type": "image-and-symbols",
15          "program": true,
16          "coreName": "CA55CPU0"
17        },
18        {
19          "file": "${workspaceFolder}/build/Debug/load_CPU1.mot",
20          "type": "image-and-symbols",
21          "coreName": "CA55CPU0"
22        },
23        {
24          "file": "${workspaceFolder}/build/Debug/R8A779F0_CA55_CPU1.elf",
25          "type": "image-and-symbols",
26          "program": true,
27          "coreName": "CA55CPU1"
28        }
29      ],
30      "target": {
31        "deviceFamily": "RCAR",
32        "device": "R8A779F0_CA55",
33        "debuggerType": "E2ARM",
34      }
35    }
36  ]
37}
The entries in the “images” array can have “coreName”, “file”, “offset”, “program” and “type” properties. Here are the details of these properties:
Property |
Description |
|---|---|
coreName: string (optional) |
Specifies which core is responsible for loading the image. This field should be set when performing multicore debugging. |
file: string (required) |
The path of the image. Using special variables are also available. Some possible usages are:
|
offset: string (optional) |
Memory offset (start address) which is targeted for the image to be loaded into. Parameter is requires hexadecimal format starting with 0x (e.g. 0x1000). If it is not provided, the default value will be 0x0. |
program: boolean (optional) |
This is a boolean property marks the entry to be considered as the main program executable. It is expected just one or none of the entries have “program”: true definition. If none of the image entries have “program”: true definition, first the file defined in the “program” property of the launch configuration will be loaded, and then the “images” will be loaded after the “program”. {
"type": "renesas-hardware",
"request": "launch",
"name": "Renesas GDB Debug",
"program": "${workspaceFolder}/build/program.elf",
"images": [
{
"file": "${workspaceFolder}/images/additional.elf",
"type": "image-and-symbols"
}
],
"target": {
"device": "R7FA2E1A9",
"deviceFamily": "RA",
"debuggerType": "SEGGERJLINKARM"
}
}
If one of the images have “program”: true definition, then the “program” in the launch configuration will be ignored. Only, the entries defined in the “images” array will be loaded into the device. {
"type": "renesas-hardware",
"request": "launch",
"name": "Renesas GDB Debug",
"program": "${workspaceFolder}/build/ignored.elf",
"images": [
{
"file": "${workspaceFolder}/images/program.elf",
"type": "image-and-symbols",
"program": true
},
{
"file": "${workspaceFolder}/images/additional.elf",
"type": "image-and-symbols"
}
],
"target": {
"device": "R7FA2E1A9",
"deviceFamily": "RA",
"debuggerType": "SEGGERJLINKARM"
}
}
If multiple entries have “program”: true definition, only the first entry with the “program”: true definition considered as the main program. Still, all the images defined in the “images” array will be loaded into the device. {
"type": "renesas-hardware",
"request": "launch",
"name": "Renesas GDB Debug",
"program": "${workspaceFolder}/build/ignored.elf",
"images": [
{
"file": "${workspaceFolder}/images/program.elf",
"type": "image-and-symbols",
"program": true
},
{
"file": "${workspaceFolder}/images/additional.elf",
"type": "image-and-symbols"
},
{
"file": "${workspaceFolder}/images/other.elf",
"type": "image-and-symbols",
"program": true
},
],
"target": {
"device": "R7FA2E1A9",
"deviceFamily": "RA",
"debuggerType": "SEGGERJLINKARM"
}
}
|
type: enum (optional) |
The “type” property defines the type of the image. This describes the loading procedure of the image. It is optional, if it is not defined, the default will be image-and-symbols. Values:
|
19.11. RTOS Integration
Note
Available for renesas-hardware and renesas-simulator debug adapters.
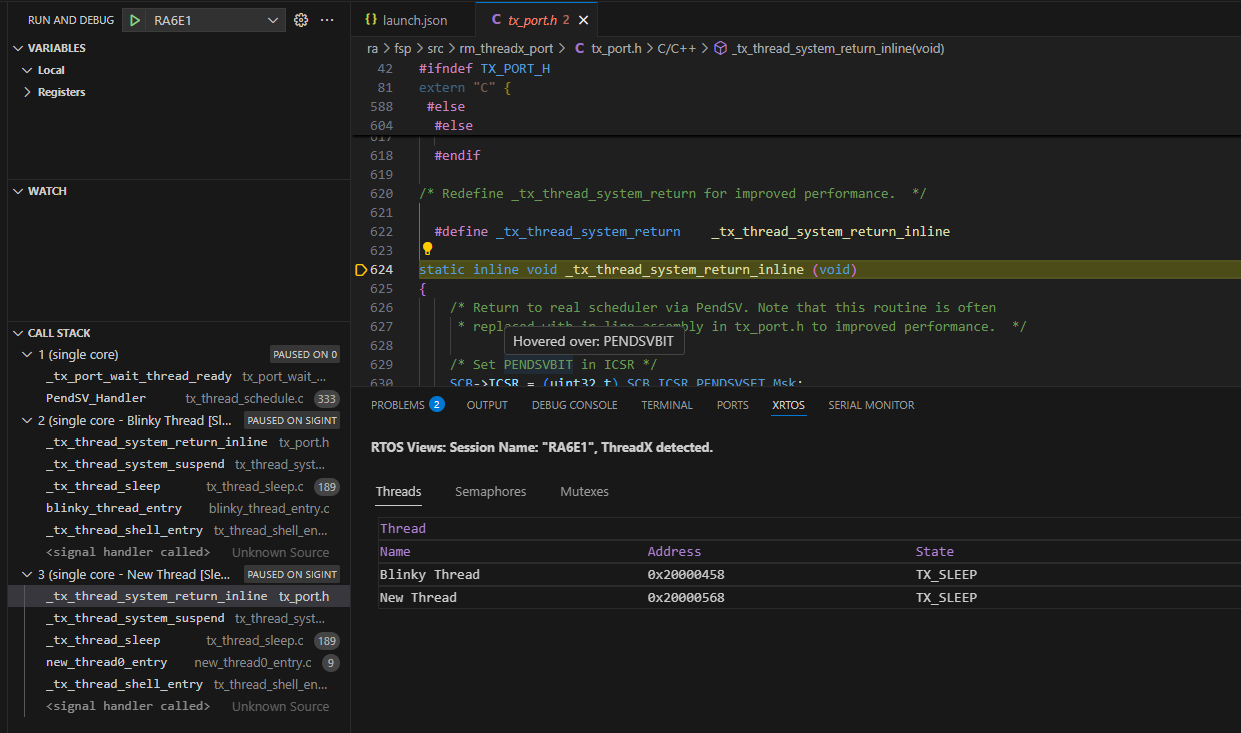
When debugging with an RTOS system, you could set rtosIntegration launch property in the target definition to true to show all initialized threads directly in the Call Stack view.
Example with RA and ThreadX:
 1{
 2  // Use IntelliSense to learn about possible attributes.
 3  // Hover to view descriptions of existing attributes.
 4  // For more information, visit: https://go.microsoft.com/fwlink/?linkid=830387
 5  "version": "0.2.0",
 6  "configurations": [
 7    {
 8      "type": "renesas-hardware",
 9      "request": "launch",
10      "name": "RA6E1",
11      "target": {
12        "deviceFamily": "RA",
13        "device": "R7FA6E10F",
14        "debuggerType": "SEGGERJLINKARM",
15        "rtosIntegration": true
16    }
17  ]
18}
If there are too many RTOS threads and it takes too much time to display them in Call Stack view, you could set -uOSRestriction= server parameter to 1 to only update for current executing thread. Other threads will display information when you suspend them manually.
Example:
 1{
 2  // Use IntelliSense to learn about possible attributes.
 3  // Hover to view descriptions of existing attributes.
 4  // For more information, visit: https://go.microsoft.com/fwlink/?linkid=830387
 5  "version": "0.2.0",
 6  "configurations": [
 7    {
 8      "type": "renesas-hardware",
 9      "request": "launch",
10      "name": "RA6E1",
11      "target": {
12        "deviceFamily": "RA",
13        "device": "R7FA6E10F",
14        "debuggerType": "SEGGERJLINKARM",
15        "rtosIntegration": true,
16        "serverParameters": {
17          "-uOSRestriction=": 1
18      }
19    }
20  ]
21}
19.12. Using CMake Tools Bar in VSCode
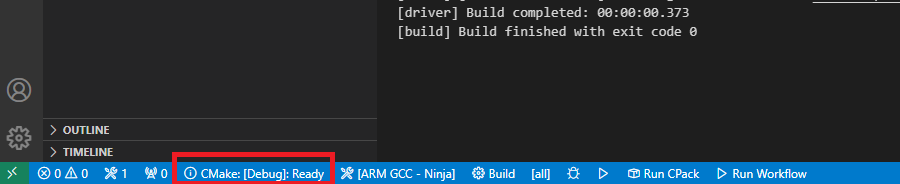
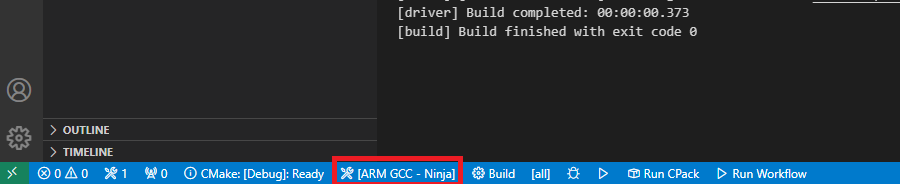
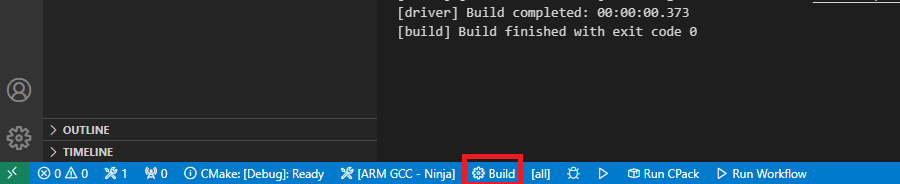
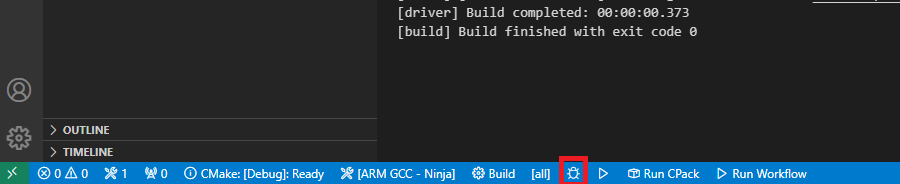
Renesas Extensions are installing the CMake Tools Extension by default to manage the CMake build operation. The CMake Tools Extension adds a variety of controls into the status bar of VSCode, Developers can do the following operations:
Manage the build type by clicking the [Build Type] button:
Select the Active CMake Kit by clicking the [Active Kit] button:
Build the project by clicking the [Build] button:
Start debugging the project by clicking the [Debug] button:
19.13. Using COMPORT debugger for RL78 devices
Some types of Renesas RL78 devices support com port connection for debugging operations. Developers can use COMPORT debugger type to start debug session using com port connection. Format of the launch configuration for COMPORT debugger type is shown below:
launch.json format:
 1{
 2    // Use IntelliSense to learn about possible attributes.
 3    // Hover to view descriptions of existing attributes.
 4    // For more information, visit: https://go.microsoft.com/fwlink/?linkid=830387
 5    "version": "0.2.0",
 6    "configurations": [
 7        {
 8            "type": "renesas-hardware",
 9            "request": "launch",
10            "name": "<display name of the configuration>",
11            "target": {
12                "deviceFamily": "RL78",
13                "device": "<device code>",
14                "debuggerType": "COMPORT",
15                "comPort": "<connection port (e.g. COM1)>"
16            }
17        }
18    ]
19}
The following configuration is an example launch configuration for R7F100GLG device connected via COM1 port:
launch.json example for using com port:
 1{
 2  // Use IntelliSense to learn about possible attributes.
 3  // Hover to view descriptions of existing attributes.
 4  // For more information, visit: https://go.microsoft.com/fwlink/?linkid=830387
 5  "version": "0.2.0",
 6  "configurations": [
 7    {
 8      "type": "renesas-hardware",
 9      "request": "launch",
10      "name": "Renesas GDB Debugging",
11      "target": {
12        "deviceFamily": "RL78",
13        "device": "R7F100GLG",
14        "debuggerType": "COMPORT",
15        "comPort": "COM1"
16      }
17    }
18  ]
19}
19.14. Using SEGGER J-Link Tunnel Debugging
SEGGER J-Link supports tunnel debugging, which enables starting a debug session on a remote device using J-Link Tunnelling. With Renesas Hardware Debugger, you can easily access to configure this feature to start a debug session on a remote device for Dialog, RA and RISC-V MCU device families.
Note
Before starting this guide, use the following link to download the latest J-Link software that is suitable for your operating system:
https://www.segger.com/downloads/jlink/
For more details about how J-Link Remote Server works, please refer to the SEGGER documentation:
https://www.segger.com/products/debug-probes/j-link/tools/j-link-remote-server/
Firstly, you need to connect your device and start the SEGGER J-Link Remote Server on your remote host machine. Please perform the following steps for this operation:
Connect your device to your remote host machine.
Start the SEGGER J-Link Remote Server program on your remote host machine.
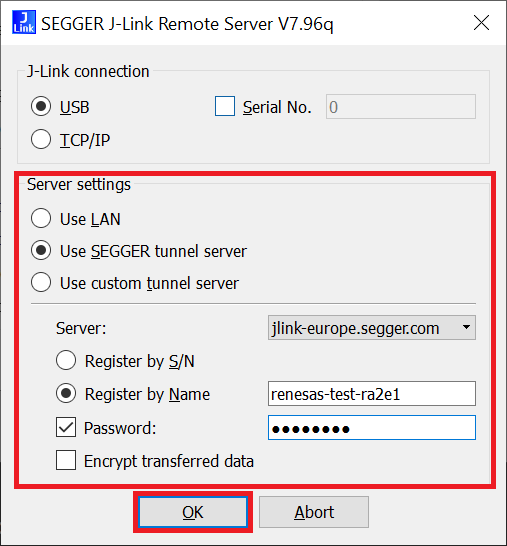
Configure the tunnel server settings.
3.1. Select connection method, for example, select “Use SEGGER tunnel server”.
3.2. Choose the nearest SEGGER tunnel to your location.
3.3. Choose either “Register by S/N” or “Register by Name” for the identifier definition. If you choose “Register by S/N”, then the serial number of the device will be used in the identifier definition; or you can choose “Register by Name” and define the identifier (Please note that, here, the name is defined as renesas-test-ra2e1 as an example, please choose a different unique value for your connection settings).
3.4. Set a password for the connection. We strongly recommended to set a password for protecting the device connections.
Click “OK” to continue.
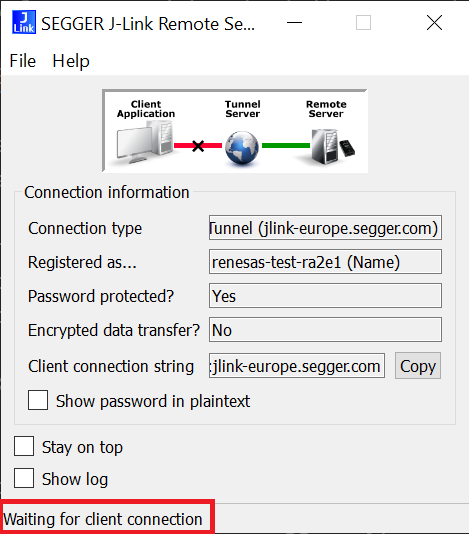
In the second window, you can see that J-Link Remote server is waiting for client connections.
Secondly, we are going to define the launch configuration in the project to connect to the remote device during the debug session. Go to the .vscode/launch.json file and define the debug launch configuration as described below:
launch.json format for Dialog and RA device families:
{
  // Use IntelliSense to learn about possible attributes.
  // Hover to view descriptions of existing attributes.
  // For more information, visit: https://go.microsoft.com/fwlink/?linkid=830387
  "version": "0.2.0",
  "configurations": [
    {
      "type": "renesas-hardware",
      "request": "launch",
      "name": "<display name of the configuration>",
      "target": {
        "deviceFamily": "<device family, RA or Dialog>",
        "device": "<device code>",
        "debuggerType": "SEGGERJLINKARM",
        "tunnel": {
          "server": "<tunnel server address>",
          "identifier": "<serial number or defined name in the connection>",
          "password": "<password for connecting to the device>"
        }
      }
    }
  ]
}
launch.json format for RISC-V MCU device family:
{
  // Use IntelliSense to learn about possible attributes.
  // Hover to view descriptions of existing attributes.
  // For more information, visit: https://go.microsoft.com/fwlink/?linkid=830387
  "version": "0.2.0",
  "configurations": [
    {
      "type": "renesas-hardware",
      "request": "launch",
      "name": "<display name of the configuration>",
      "target": {
        "deviceFamily": "RISC-V MCU",
        "device": "<device code>",
        "debuggerType": "SEGGERJLINKRISCV",
        "tunnel": {
          "server": "<tunnel server address>",
          "identifier": "<serial number or defined name in the connection>",
          "password": "<password for connecting to the device>"
        }
      }
    }
  ]
}
The following configuration is an example launch configuration for using SEGGER J-Link Tunnel to connect to a remove RA2E1 device:
launch.json example for using SEGGER J-Link Tunnel for RA:
{
  // Use IntelliSense to learn about possible attributes.
  // Hover to view descriptions of existing attributes.
  // For more information, visit: https://go.microsoft.com/fwlink/?linkid=830387
  "version": "0.2.0",
  "configurations": [
    {
      "type": "renesas-hardware",
      "request": "launch",
      "name": "Renesas GDB Debugging with SEGGER J-Link Tunnel",
      "target": {
        "deviceFamily": "RA",
        "device": "R7FA2E1A9",
        "debuggerType": "SEGGERJLINKARM",
        "tunnel": {
          "server": "jlink-europe.segger.com",
          "identifier": "renesas-test-ra2e1",
          "password": "EnterThePasswordHere"
        }
      }
    }
  ]
}
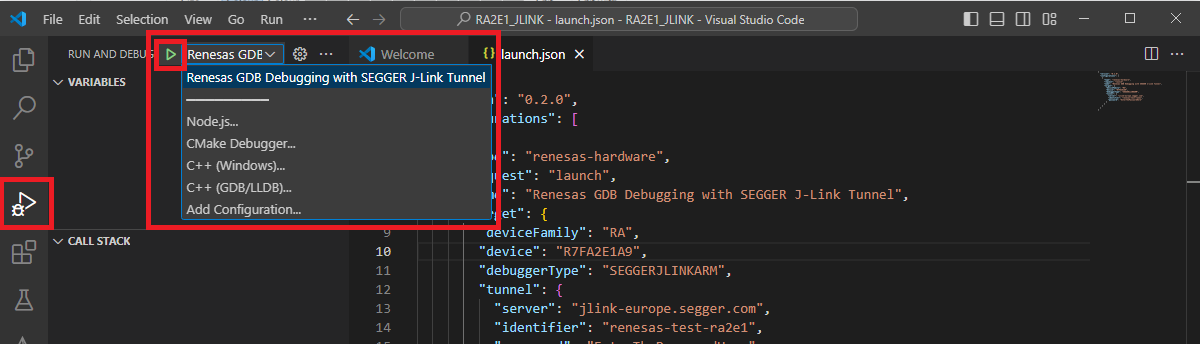
Now, we are ready to start a debug session to connect to the remote device. To start the debug session, go to the “Run and Debug” tab in VSCode, then select the configuration, and click the “Start Debugging” button.
Note
For more details about starting the debug session, please refer to the section “Starting the Debug Session”