This panel is used to display the acquired function information.
The following types of function are displayed in this panel.
Note, however, that the function information in the files not to be analyzed is not displayed in this panel (see "1.1.1 What is analyzed").
See "2.1 Overview" for details on how to display the function information.
[E20[RX]] |
[CC-RX] |
[CC-RX] |
You can set filters for displaying function information on this panel (see "2.6.5 Filter the analysis information"). |
This panel can be zoomed in and out by |
 in the tool bar, or by moving the mouse wheel forward or backward while holding down the [Ctrl] key.
 [RH850] |
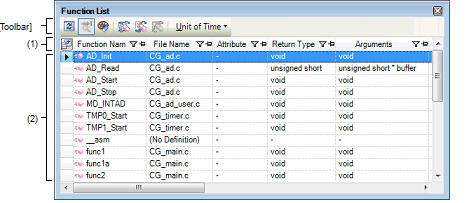
The following items are explained here.
On the toolbar in the Main window, click the |
 button.
 The name of the item of the acquired function information is displayed.
Marks (icons) that are displayed at the name of the item indicate as follows:
|
Indicates whether there is a sort order setting (see "2.6.4 Sort the analysis information"). |
|
|
Indicates whether there is a filter display setting (see "2.6.5 Filter the analysis information"). |
|
|
Indicates whether display is locked (see "2.6.3 Lock the specific column to display"). |
|
|
Indicates that a message relating to information about this item has been output to the Output panel. Hover the mouse over it to display a pop-up with the last message to be output. |
 /
/ 
 /
/ 
 /
/ 

Columns to display can be customized via mouse operations in this area. |
|
Opens the Column Chooser dialog box in order to sort and show/hide the items (columns) displayed in the panel, and return customized settings to the defaults (see "2.6 Customize Display Method"). |

This area displays the acquired function information.
The analysis tool acquires two types of function information: Static analysis information and Dynamic analysis information. The timing when each type of information can be displays differs (see "1.1.2 Types of analysis information").
When the active project is changed while displaying the function information, the function information of the target project is displayed. Note, however, that if the cross reference information has not been generated in the project or the analysis tool is not supported by the project, nothing is displayed on this panel.
The value of the information that has been changed because of the execution of a program is shown highlighted (the color depends on the configuration in the [General - Font and Color] category of the Option dialog box). To reset the highlighting, click the  button on the toolbar.
The items and details acquired as function information are as follows:
|
Displays the name of the global function, the file-internal static function or the member function (function that is defined with class type) that is defined/referenced in the C/C++ source file. Up to 1024 characters can be displayed. The meanings of an icon displayed is as follows: If the function is a const member function/volatile member function, then "const"/"volatile" is displayed immediately after the function name. |
|||||
|
Displays the name of the class to which the function belongs. If it is a template class, then the number of template arguments are also displayed in the format of "class name<T: the number of template arguments>". Note, however, that if the function is not a member function, or if analysis was not completed, then this will be blank. |
|||||
|
Displays the name of the namespace to which the function belongs. If the namespace is nested, then it is displayed in the format of "namespace name::namespace name". If it is an anonymous namespace, then "<unnamed>"is displayed. Note, however, that if analysis was not completed, then this will be blank. |
|||||
|
Displays the file name (without path) of the C/C++ source file where the function is defined. Note, however, that if it is not defined in a C/C++ source file in project, or if analysis was not completed, then this will display "(No Definition)". If it is defined in a header file, then the name of the header file is displayed. |
|||||
|
Displays the absolute path of the C/C++ source file where the function is defined. Note, however, that if it is not defined in a C/C++ source file in project, or if analysis was not completed, then this will be blank. If it is defined in a header file, then the absolute path of the header file is displayed. |
|||||
|
Displays the following information about PE in which the function is executed. Note that this item appears only when the selected microcontroller version supports multi-core. |
|||||
|
Displays the following information about the source of the function information.
See "2.12 Import or Export Information File" for details on the import function. |
|||||
|
Displays the access specifier being declared to the member function. Note, however, that this will display "-" if analysis is not complete. |
|||||
|
Displays the function's symbol attributes/symbol-modifier attributes. If there are multiple attributes, then they are displayed separated by commas (","). Note, however, that this will display "-" if analysis is not complete. |
|||||
|
Displays the return type of the functionNote 2. Note, however, that this will display "-" if analysis is not complete. |
|||||
|
Displays the number of arguments of the function in decimal number notation. If the function has a variable argument parameter, then the number of arguments defined at the location where the function is defined is displayed. Note, however, that this will display "-" if analysis is not complete. |
|||||
|
Displays the argument type and formal argument name of the functionNote 2. If there are multiple arguments, then they are displayed separated by commas (","). If the function has a variable argument parameter, then the argument type and argument name defined at the location where the function is defined are displayed. If there are no arguments, then "void" is displayed. Note, however, that this will display "-" if analysis is not complete. There is no limit to display the number of pointers (the first dimension of an array is handled as a pointer). |
|||||
|
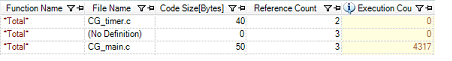
Displays the function's code size in decimal number notation. Note, however, that this will display "-" if analysis is not complete. |
|||||
|
Displays the function's start address in hexadecimal number notation. The number of digits to display is equivalent to the maximum address value of the selected microcontroller. Note, however, that this will display "-" if analysis is not complete. |
|||||
|
Displays the end address of the function aligned in ROM in hexadecimal number notation. The number of digits to display is equivalent to the maximum address value of the selected microcontroller. Note, however, that this will display "-" if analysis is not complete. |
|||||
|
Displays the number of times the function is referenced in the program, in decimal number notation. Prototype declarations are also counted as references. Code in C/C++ source files that is referenced but is eliminated by the preprocessor during compilation (e.g. via "#if" or "#ifdef" statements) is not included in the number of references (it is also not output by the search results from [Find All References] in the context menu). References to functions via assignment to function pointers are not included in the reference count. Note, however, that this will display "-" if analysis is not complete. |
|||||
|
Displays the number of times the function was executed (called) as a result of program execution, in decimal number notationNote 3. This function counts the number of times that the instruction located at the address allocated to the function label is executed. For this reason, an invalid value may be displayed if the measurement starts midway through the execution of a function. Note, however, that this will display "-" if the debug tool's Trace function is disabled, or analysis is not complete. [E1/E2 Lite/E20[RL78]][EZ Emulator[RL78]]
The execution count is calculated according to the following conditions, because only the branch origin address can be acquired from the trace data. |
|||||
|
[Full-spec emulator] |
Displays the execution time of the function (the time executing the code in the function body, not including subroutines)Note 3, 4. The unit of time can be changed by selecting [Unit of Time] from the [Toolbar], or from the Property panel's [Settings] tab, in the [General] category, changing the [Unit of time] property (see the [Unit of time] property in the Property panel for details on the time-display format). Note, however, that this will display "-" if the debug tool's Trace function is disabled, or analysis is not complete. |
||||
|
[Full-spec emulator] |
Displays the proportion of total execution time (range that could be obtained as trace data) taken by the execution time of the target function, rounded to the nearest two decimal places, in the range 0.00 to 100.00Note 3, 4. The level of shading of the cell's background color indicates the proportion. Note, however, that this will display "-" if the debug tool's Trace function is disabled, or analysis is not complete. |
||||
|
[Full-spec emulator] |
Displays the average execution time of the function ("execution time" / "number of executions")Note 3, 4. The results of calculation are displayed rounded to the nearest nanosecond. The unit of time can be changed by selecting [Unit of Time] from the [Toolbar], or from the Property panel's [Settings] tab, in the [General] category, changing the [Unit of time] property. The unit of time can be changed by selecting [Unit of Time] from the [Toolbar], or from the Property panel's [Settings] tab, in the [General] category, changing the [Unit of time] property (see the [Unit of time] property in the Property panel for details on the time-display format). Note, however, that this will display "-" if the debug tool's Trace function is disabled, or analysis is not complete. |
||||
|
Displays the code coverage rates of the function (C0: "number of bytes of code executed in the address range" / "function's code size" x 100) (see "3.2 Coverage Results"). The level of shading of the cell's background color indicates the code coverage. Note, however, that this will display "-" if the debug tool's Coverage function [IECUBE][E20[RX]][Simulator] is disabled, or analysis is not complete. |
|||||
 : Function
 : Member function
  : Template function
 This item does not appear by default. |
If including an alternative name by using "#define" or "typedef", then not the alternative name but the original type is displayed. |
Set the [Accumulate result of analysis] property in the [General] category on the [Settings] tab of the Property panel to [Yes] to display the cumulative value for each program execution. |
[E20[RX]] |
In the bottom of the [Function Name] item, the following information for each file is shown as [*Total*].
Note that "(No Definition)" displayed in the [File Name] item is treated as one file.
This item does not appear by default. |
Items of the Dynamic analysis information do not appear while disconnecting from the debug tool (default). |
[IECUBE[RL78]] |
Values of the following items for the system library functions cannot be acquired. |
If you define a static function in a header file, and include it from more than one source file, information for the header file and all source files is displayed on one line. |
[CC-RX] |
Display contents for the line for the definition of the template function |
Display contents for the line for the function using the template function |
The display of each type of information can be customized as follows: |
The current row mark ( |
 ) on the left edge of this area indicates that the column in question is the current row.
The toolbar provides the following items and functions.
|
Acquires the latest data from the debug tool, and updates the contents of this panel. |
||
|
Displays the latest information automatically by acquiring the information each time program execution stops. Note that this item is disabled when the [Refresh at program stop] property in the [General] category on the [Settings] tab of the Property panel is set to other than [Specify Individually] (this button is locked in accordance with the setting on the Property panel). |
||
|
Resets highlighting of values that have been changed by executing a program. Note that this item is disabled during execution of a program. |
||
|
Displays only the information for functions in a file(s)/category(s) currently selected in the Project Tree panel (see "(a) Linking with the Project Tree panel"). |
||
|
Displays only the information for functions starting with the word at the caret position in the Editor panel (see "(b) Linking with the Editor panel"). |
||
|
Displays only the information for functions in the common region and PE currently selected in the Debug Manager panel (see "(c) Linking with the Debug Manager panel [RH850]"). Note that this item is disabled when the selected microcontroller version does not support multi-core. or while disconnecting from the debug tool. |
||
|
The following cascade menus are displayed to specify the time unit for the analysis tool. The setting of the [Unit of time] property in the [General] category on the [Settings] tab of the Property panel is specified by default. The time unit set in this toolbar is reflected in the Property panel. |
||
|
Displays the time as "hours, minutes (0 - 59), seconds (0 - 59)". |
||
|
Displays the time in second units. The value is rounded to three decimal places. |
||
|
Displays the time in millisecond units. The value is rounded to three decimal places. |
||
|
Displays the time in microsecond units. The value is rounded to three decimal places. |
||
|
Displays the time in nanosecond units. The value is rounded to integer number. |
||
|
Displays the time in clock units. The value is rounded to integer number. Note that this item is displayed only when the selected microcontroller supports a time display in units of clock cycles. |
||


[[File] menu (Function List panel-dedicated items)]
The [File] menu for this panel provides the following items and functions.
|
Overwrites the contents of this panel to the previously saved file (see "2.14 Save Analysis Information"). Note that when the file has never been saved or the file is write disabled, the same operation is applied as the selection in [Save Function List Data As...]. |
|
|
Opens the Save As dialog box to newly save the contents of this panel to the specified text file (see "2.14 Save Analysis Information"). |
|
|
Opens the Windows dialog box to print the contents currently being displayed in this panel. |
[[Edit] menu (Function List panel-dedicated items)]
The [Edit] menu for this panel provides the following items and functions.
The context menu displayed by right-clicking on this panel provides the following items and functions.
|
Displays a list of the locations referencing the function(s) of the selected row(s), in the Output panel's [Find References] tab (see "2.11 Display List of Referencing Location"). |
||
|
Sets a breakpoint at the first line of the function at the current row (the first executable line in the target function) (see "2.9.1 Set a breakpoint to a function"). Note that this item is disabled while disconnecting from the debug tool. |
||
|
Opens the Editor panel and displays the source file in which the function of the current row is defined (see "2.7 Jump to Defined Location"). |
||
|
Opens the Disassemble panel (Disassemble1) and displays the disassemble data corresponding to the start address of the function of the current row (see "2.7 Jump to Defined Location"). Note that this item is disabled while disconnecting from the debug tool. |
||
|
Opens the Memory panel (Memory1) and displays the memory list corresponding to the start address of the function of the current row (see "2.7 Jump to Defined Location"). Note that this item is disabled while disconnecting from the debug tool. |
||
|
Copies the contents of the selected row(s) to the clipboard as character strings separated by tabs. Note that the contents of the clipboard cannot be pasted to this panel. |
||