Memory Usage is used to retrieve information from a project’s .map, .elf (Executable and Linkable Format), or .abs (Absolute) file. It provides an overview of:
Total memory size
ROM/RAM usage ratio
Detailed information on sections and symbols used in the project
It also uses the device’s memory configuration, linker script, and .map file from the project’s target device to extract:
Defined memory areas of the device
Size and used size of each memory area
Sections assigned to each memory area
The Renesas Memory Usage View automatically adapts its appearance to match the current VS Code theme.
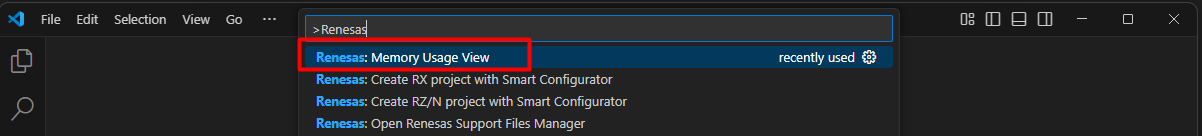
Select MEMORY USAGE view in the Renesas tab to open the Memory Usage View. You can also use the commands Renesas: Focus on Memory Usage View to show it.
The Input Dialog is used to prepare for data entry. It can be accessed via MEMORY USAGE view in the Renesas tab or command Renesas: Toggle Input Dialog in Command Palette.
7.2.1.1. How to create a Memory Usage View tab using the Input Dialog
By default, after Step1, all data is auto filled. You only need to press the New button to create Memory Usage View panel.
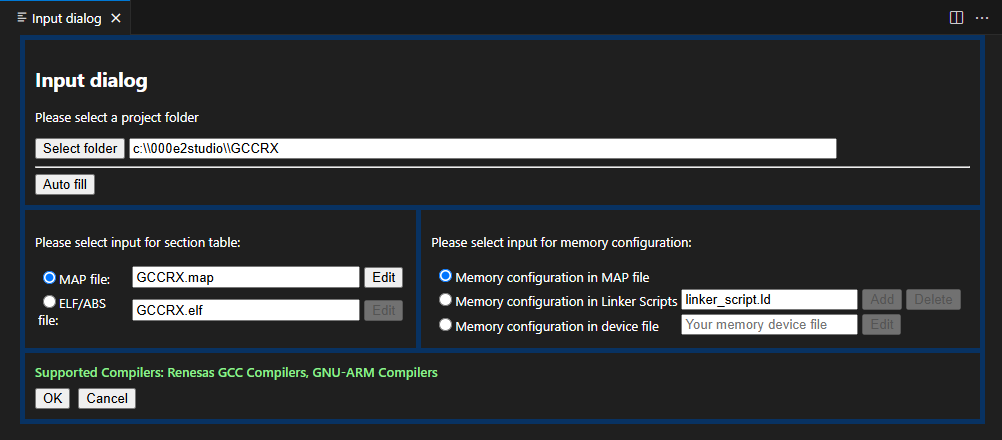
Step 1: Select Project Folder
Firstly, select the target project folder. By default, the path shows the current workspace folder. You can change the target folder by using the Select folder button.
When the Select folder button is clicked, a folder pick dialog will appear to select a different folder. After selecting a different folder, the configuration is updated automatically, including the required project name for the Memory Usage View panel, which is derived from the selected folder by default and can be edited.
A MAP file or load module (ABS or ELF) will be automatically detected. By default, MAP+ELF/ABS file(s) is selected.
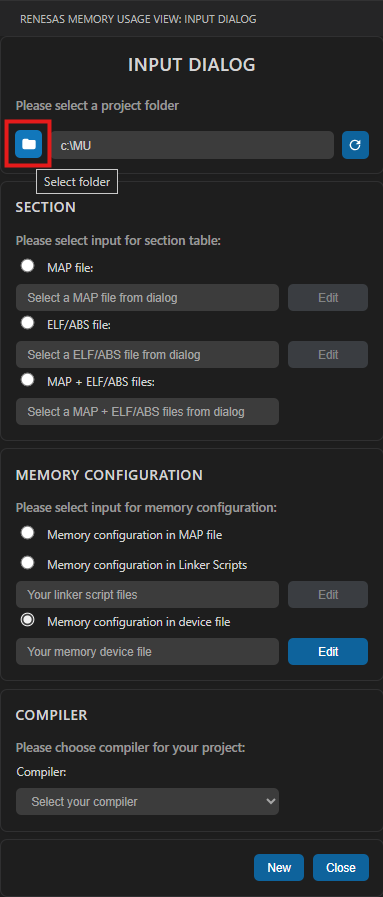
Step 3: Select input for memory configuration
Memory configuration is used for reading information of memory areas such as name, address, size. The configuration will be selected automatically, however, it can also be changed between options manually.
The automatic selection is performed in the following order:
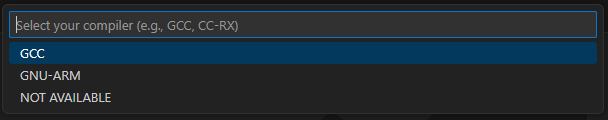
The compiler is auto-filled based on the ELF/ABS file.
If the user changes the Section input or the Memory Configuration input, they must manually select the compiler.
Step 5: Error Handling and Final Actions
When the user presses the New button, the error-handling process is executed. If no error is found, a new Memory Usage View panel is created; otherwise, the corresponding error is shown.
When the user presses the Update button, the same process is executed to apply the current Input Dialog settings to the active Memory Usage View panel. The Update button is enabled only when a Memory Usage View panel is active.
7.2.1.2. How to change the settings using Input Dialog
After modifying the settings in the Input Dialog, user can press the Update button to apply the changes to the active Memory Usage View panel.
Edit Input for Section
Users can update the MAP file or select a different external ELF/ABS file by clicking the Edit button. This allows them to choose a file outside the current project as the input source.
Edit Input for Memory Configuration
Users can modify the input files for the Linker Script and Device File in the same way by clicking the Edit button.
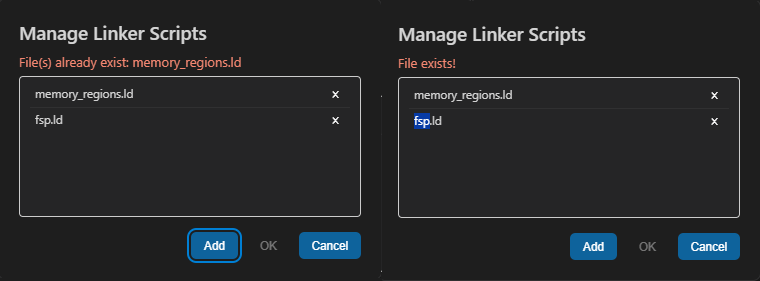
When editing the Linker Script, the Manage Linker Scripts dialog appears. This dialog lets users add, remove, or replace linker script files before applying the configuration.
If no linker script has been specified, the message “No files added yet. Please click “Add” to select file(s).” is displayed as a reminder.
Add files: Click the Add button to select one or more linker script files to include.
View full path: Hover the mouse over a file name to display its full file path.
Delete or replace files: Click the × icon to remove a file, or double-click a file to select a replacement.
Duplicate file check: An error message appears if a user tries to add existing file(s) or replace a file with one that already exists.
Duplicate message when adding or replacing a file
Click OK button to confirm all changes and apply the updated linker script file to the input for Memory Configuration.
Click Cancel button or press the Esc key to abort the current action and close the dialog without saving any changes.
Note
To change any input file, users must edit each item individually. Select the option you want to modify, then click the Edit button to update the corresponding file(s).
All changes made to these files are the user’s responsibility.
Note
Memory Configuration includes memory areas with name, address and length.
Device files should be placed under: user\.vscode\extensions\<renesas-memory-usage-view>\device_files
Current supported devices: RX, RL78, RH850, RA, RZ, RISC-V, RRQ
Renesas CC projects only support auto-find device file for those created using a Smart Configurator.
From this version, the InputDialog will save the settings for each Memory Usage View. That means when users switch among the panel views, they will see the settings specific to that view, including Project folder, Section file, Memory config file, and Compiler.
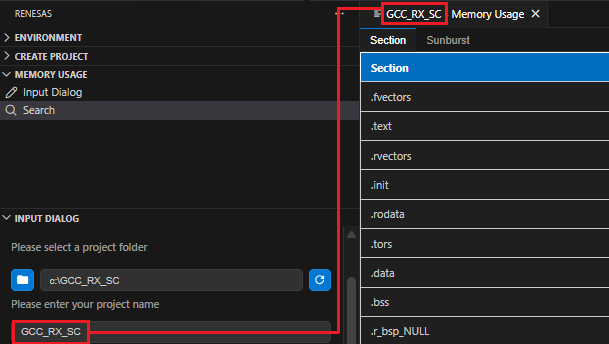
The “Section” tab is a core component of the Memory Usage View panel, designed to present a comprehensive table view of all memory sections parsed from either a .map or .elf/abs file or .map+.elf/abs file.
When MAP+ELF/ABS is selected, keep the sections from the .map file and add any sections from the .elf/abs file that are not already present in the map file.
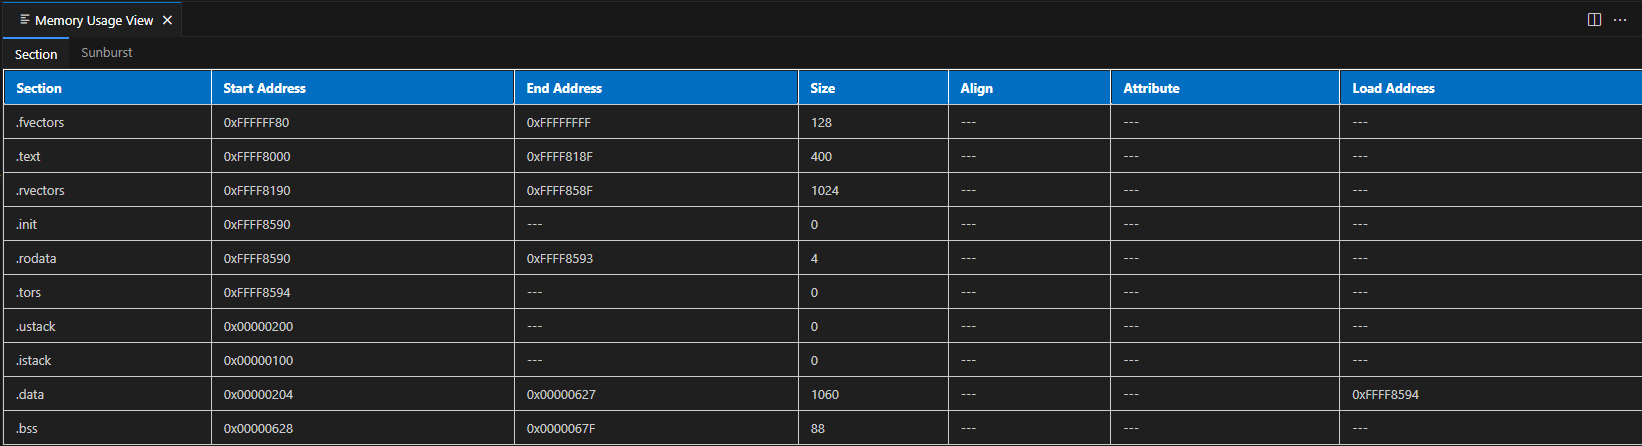
This table provides detailed metadata for each memory section, with the following columns:
Section: Name of the memory section (e.g., .text, .data, .bss, etc.).
Start Address: The starting address of the section in memory.
End Address: The address of the last byte occupied by the section.
Size: The size of the section in bytes.
Align: Alignment requirement of the section (if available).
Attribute: Section attributes such as read/write/execute (if available).
Load Address: The load-time address for the section, used primarily in embedded systems.
Each row in the table corresponds to a specific memory section. Sections with a size of 0 or missing address fields (indicated by ---) may represent unused or reserved regions.
This layout offers an at-a-glance overview of memory allocation, helping developers and engineers quickly assess section sizes, memory usage, and layout across the address space.
To ensure consistency and clarity:
All data is automatically parsed from the selected input file.
Sections are displayed in the order they appear in the memory map.
Empty or unavailable values are denoted using dashes (---) for better readability.
The Section tab provides several functions to support efficient navigation and viewing of table data:
Hover highlight: The background colour of a row changes when the pointer moves over it, helping users identify the current row.
Row selection: Users can select one or multiple rows.
Single selection: Click a row.
Multiple selection: Use Ctrl (Windows) or Command (MacOS) to select individual rows or Shift to select a range.
Scrolling: When the panel is resized, the table supports both vertical and horizontal scrolling to ensure all content remains accessible.
Theme adaptation: The table automatically adjusts its colour and appearance to match the active application theme.
Sticky header: The header row remains fixed at the top of the table while the data rows scroll, ensuring column names are always visible.
Example: Address Derivation from MAP File
The following illustrates how section addresses are extracted from a typical .map file:
SECTION                            START       END      SIZE   ALIGN    ATTRIBUTE
SU
                                00000004  00000103       100       4         DATA
SI
                                00000104  00000403       300       4         DATA
B_1
                                00000404  00000404         0       1         DATA
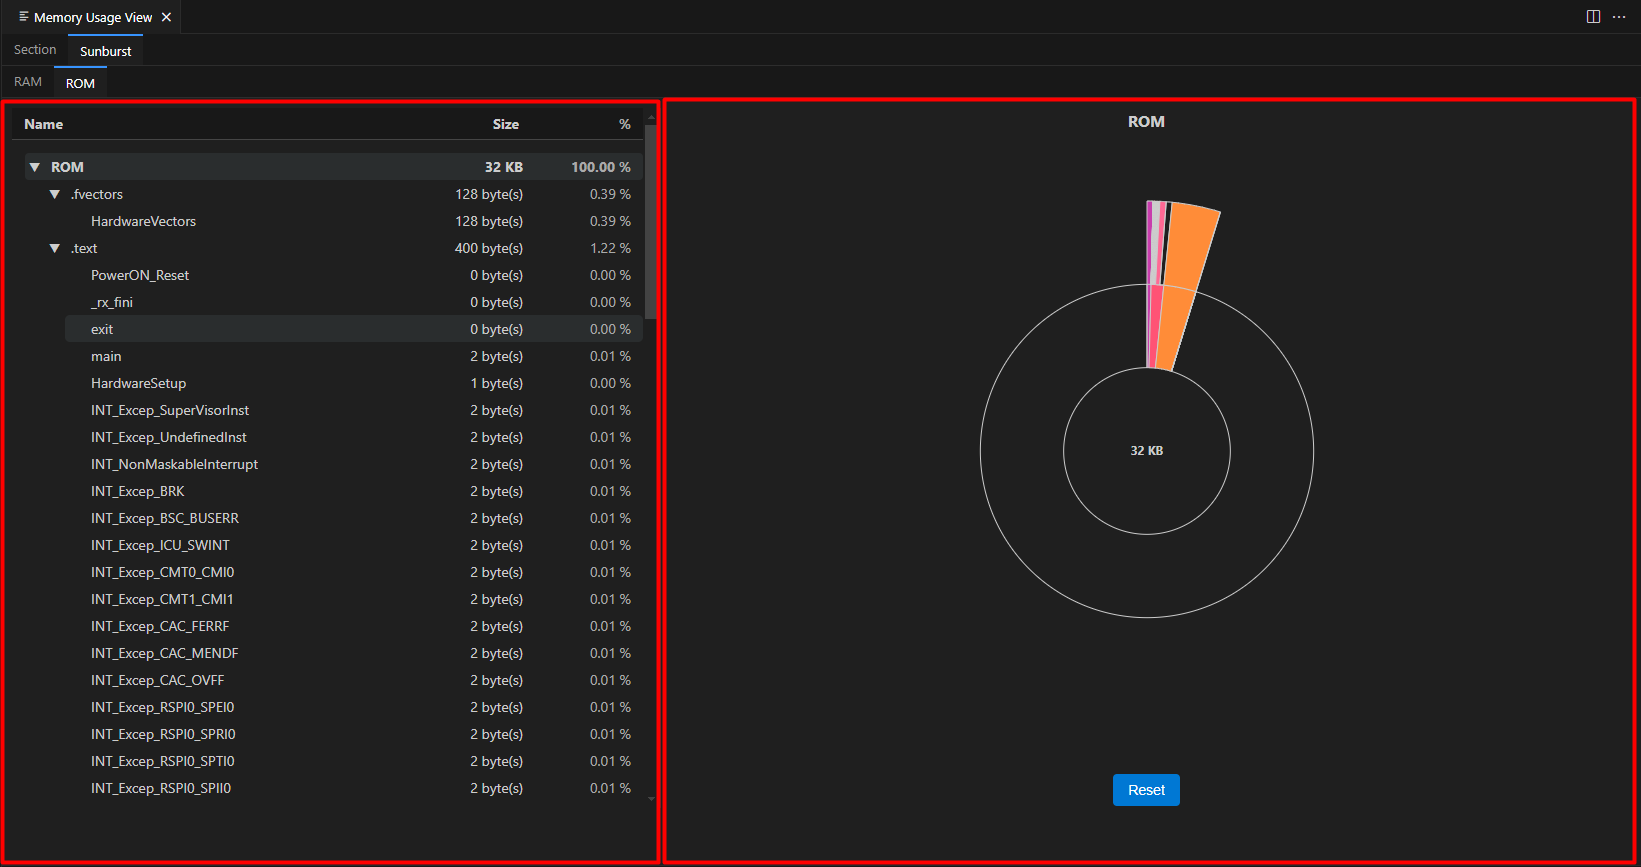
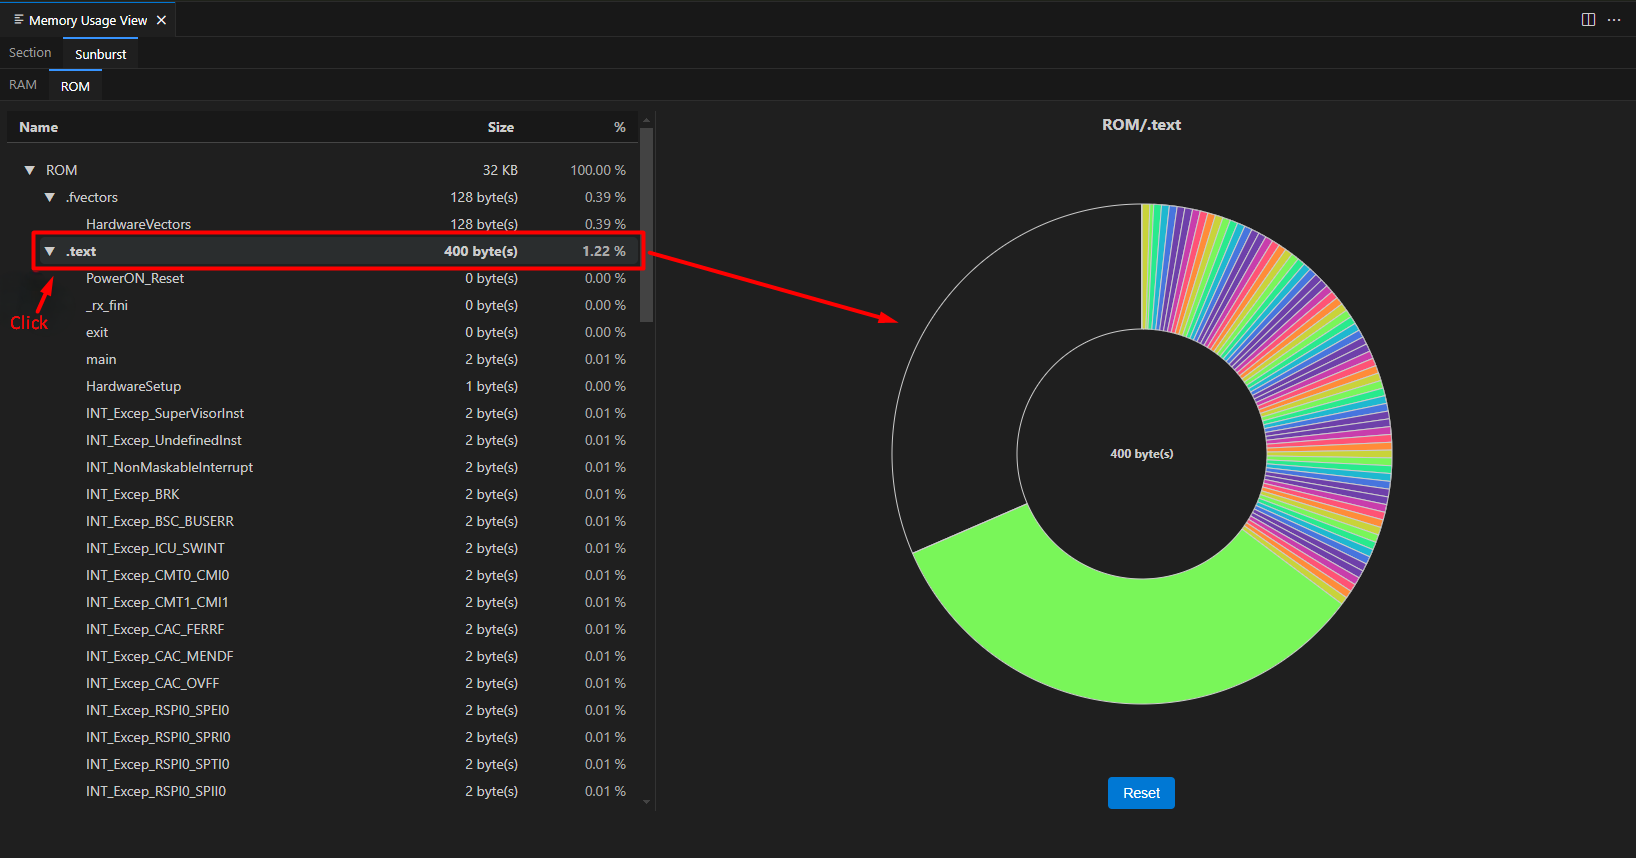
The “Sunburst” tab is a primary component of the Memory Usage View panel. When selected, it presents a dual-pane layout featuring a hierarchical memory tree alongside a corresponding sunburst chart.
Beneath the Sunburst tab, a set of sub-tabs represents various memory regions, such as RAM, ROM, FLASH, and others.
The active memory region is clearly highlighted with a blue top border and a distinct background colour, allowing users to easily identify the selected region.
When a memory region (sub-tab) is selected, the memory tree appears on the left side of the interface. This tree follows a three-level hierarchical structure:
Root node: Represents the memory region (e.g., RAM, ROM, FLASH).
Section nodes: Children of the root node, representing memory sections (e.g., .data, .bss, .text).
Symbol nodes: Children of section nodes, representing individual symbols (e.g., main, exit).
Each node displays the following information:
Name
Memory size (in bytes). For the root node, the unit switches to KB if the size exceeds 1024 bytes.
Percentage of the total region size
Nodes that can be expanded or collapsed include an arrow icon (▼) to the left of the node label, allowing users to expand or collapse individual nodes.
A toggle icon located to the left of the Name column header enables users to expand or collapse all nodes simultaneously.
A special node labelled NONE-USAGE is included to represent unallocated or unused memory within the region.
Interaction:
Hover highlight: The background colour of a row changes when the pointer moves over it, helping users identify the current row.
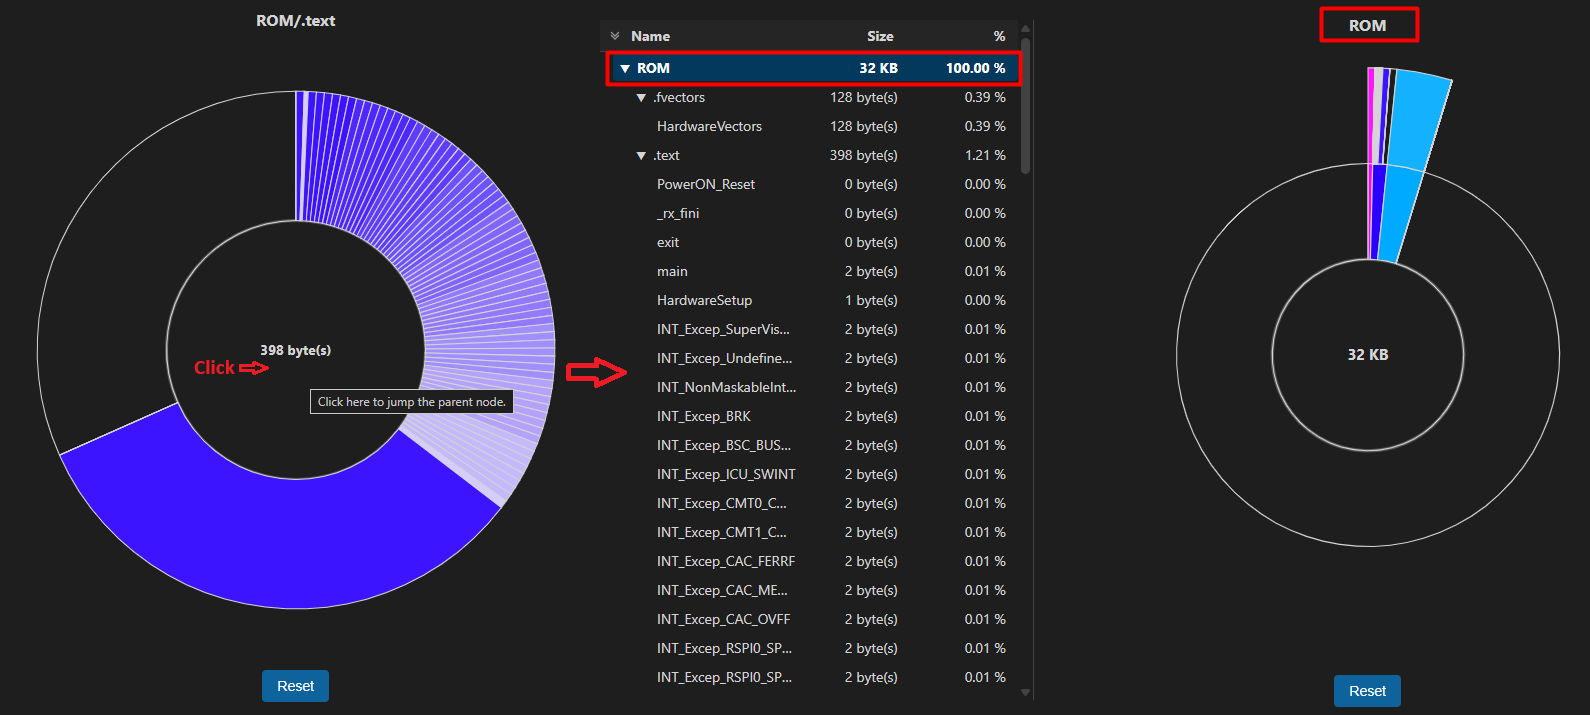
Clicking on any node in the tree the row is highlighted and updates the sunburst chart to visually focus on the corresponding node and its hierarchy.
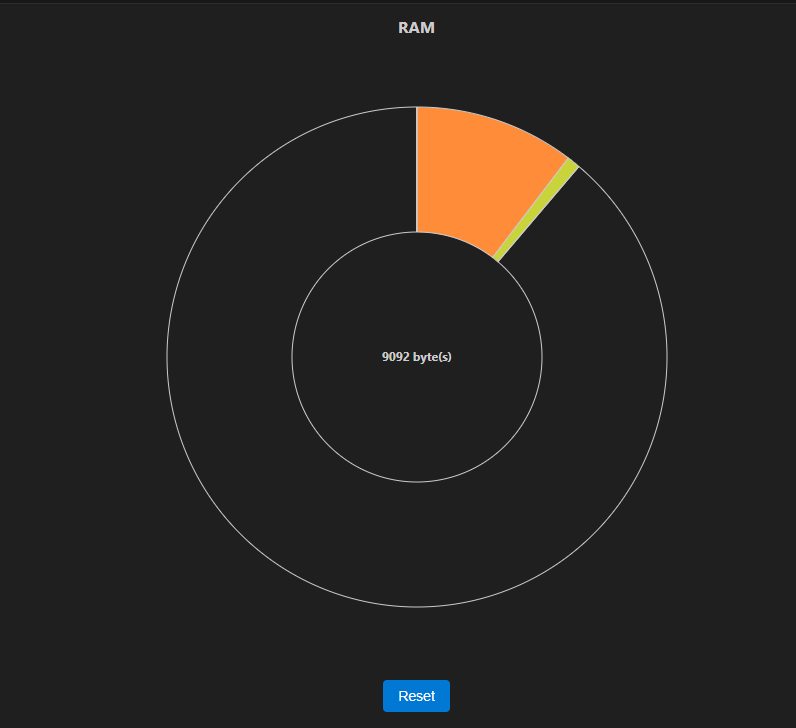
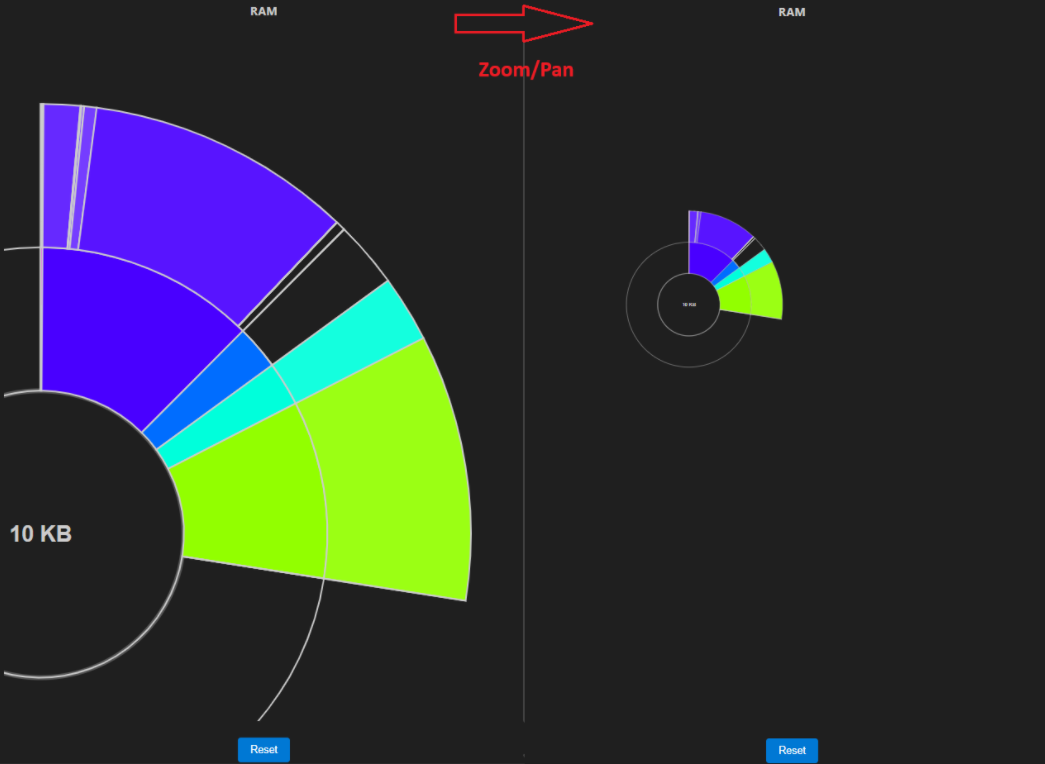
The sunburst chart is displayed on the right side of the interface, providing a visual representation of memory usage using concentric circles.
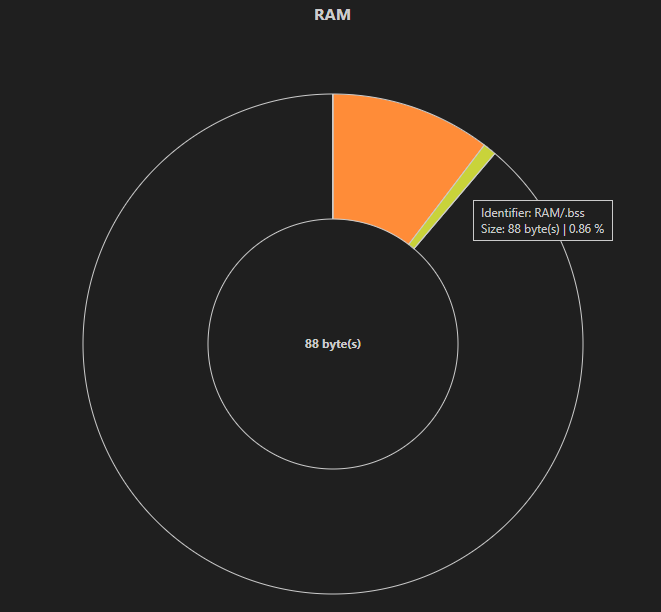
A label above the chart shows the currently selected node’s name (e.g., RAM, RAM/.bss).
At the centre of the chart, the size of the selected node is displayed in bytes. For the root node, the unit automatically switches to KB if the size exceeds 1024 bytes.
The Reset button, located below the Sunburst chart, restores the chart to its initial view.
When hovering over a segment, the centre temporarily updates to display the size of the hovered segment, following the same rule.
Chart Structure
The innermost ring represents memory sections (e.g., .bss, .text).
The outer rings represent symbols within those sections.
Colour Scheme
Each section is assigned a unique base colour.
Symbols within a section inherit that base colour with varying brightness levels depending on their size:
Larger symbols appear darker.
Smaller symbols appear lighter.
The ‘NONE-USAGE’ area, representing unused or unallocated memory, is rendered in the same colour as the background with the circle outline.
The user can zoom in or out, and pan the chart to inspect small segments in detail.
This action changes only the display of the chart and does not affect the data hierarchy.
Mouse operations
Zoom: Use the mouse wheel to zoom in or out.
Pan: Click and drag to move (pan) the chart.
Keyboard shortcuts
Press [Enter] or [Space] to reset the zoom level and position.
Press [+] (or [=] or [Shift] + [↑]) to zoom in.
Press [-] (or [_] or [Shift] + [↓]) to zoom out.
Press [↑] or [↓] to pan the chart up or down.
Press [←] or [→] to pan the chart left or right.
Keyboard shortcuts are available only when the Sunburst chart is focused.
Reset
When the users click Reset button, the following changes occur:
The chart returns to the root node with the default zoom level and position.
The root node in the tree view is highlighted, reflecting the current chart view.
Use this button to quickly return to the starting point after drilling down into child nodes.
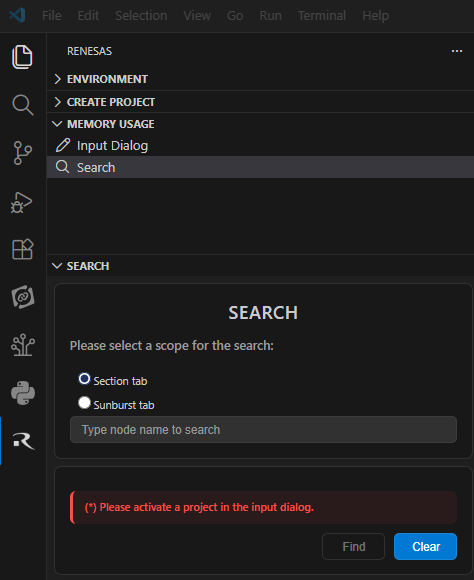
The Search helps users quickly find memory sections or symbols within the Renesas Memory Usage View, improving analysis efficiency. It can be accessed via MEMORY USAGE view in the Renesas tab or command Renesas: Toggle Search in Command Palette.